看多
BCCBTC - Reversion to the Mean Trade
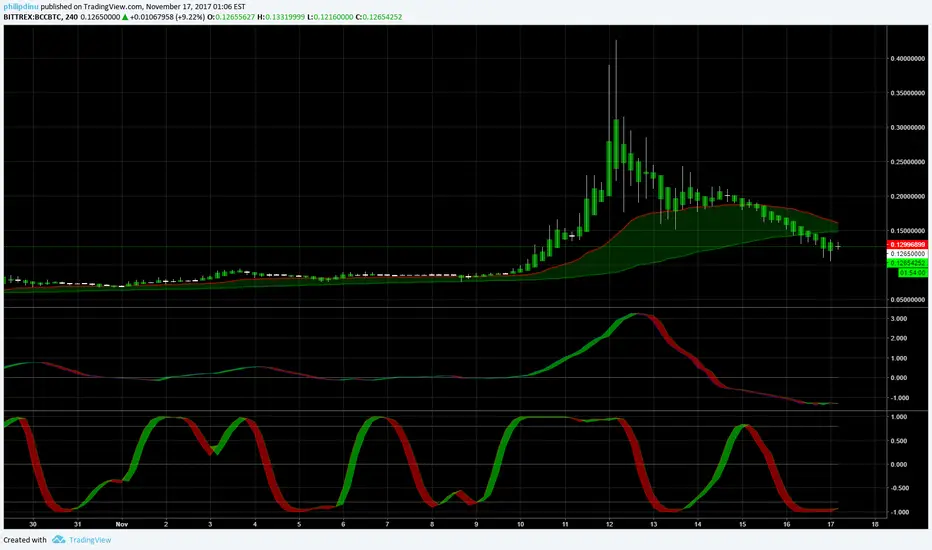
BCC has had an extreme move to the downside with bitcoin making new highs, and it is finally starting to show some exhaustion. The daily chart is showing a bounce into and out of the MA cloud indicating a bullish trend continuation. Momentum appears to be slowing down on the 4H chart with a doji HA candlestick forming and indicating price could potentially change direction. I will be waiting for the next candle to open and indicate a strong momentum to the upside before entering positions. Heavily oversold weighted RSI is also a good indication price could swing to the upside and attempt to touch the MA cloud or possibly the 50% fib area.
交易進行
positions opened on strong momentum to upside.交易進行
Price progressing through MA cloud:交易進行
手動結束交易
+10% Closing trade Manually since strong momentum did not continue through the 4H MA cloud and a Doji apears to be forming under the cloud. I will be watching the next 4H candle for momentum before deciding if I reopen positions, price could go either way. 註釋
I will revisit bcash after btc makes its new gains.註釋
A second doji candle is forming within the range of the first one, creating what I like to call a white doji. This is usually indicative that a big price move is coming.I'll be watching the next 4H candle for momentum and direction.
註釋
For reference, I'm marking the other white doji candles on the 4H chart:交易進行
Opening up some positions with the good looking 4H candle with bullish momentum:交易進行
交易進行
Moving as expected. Non Heiken Ashi chart for comparison:註釋
Another white doji is forming after a small bull run. I will be looking to close positions on this candle and wait for the open of the next candle to determine next trend direction.
手動結束交易
+15%. Closing positions on the close of this candle and will look at opening new positions depending on how price moves.Total profit so far +25%.
免責聲明
這些資訊和出版物並不意味著也不構成TradingView提供或認可的金融、投資、交易或其他類型的意見或建議。請在使用條款閱讀更多資訊。