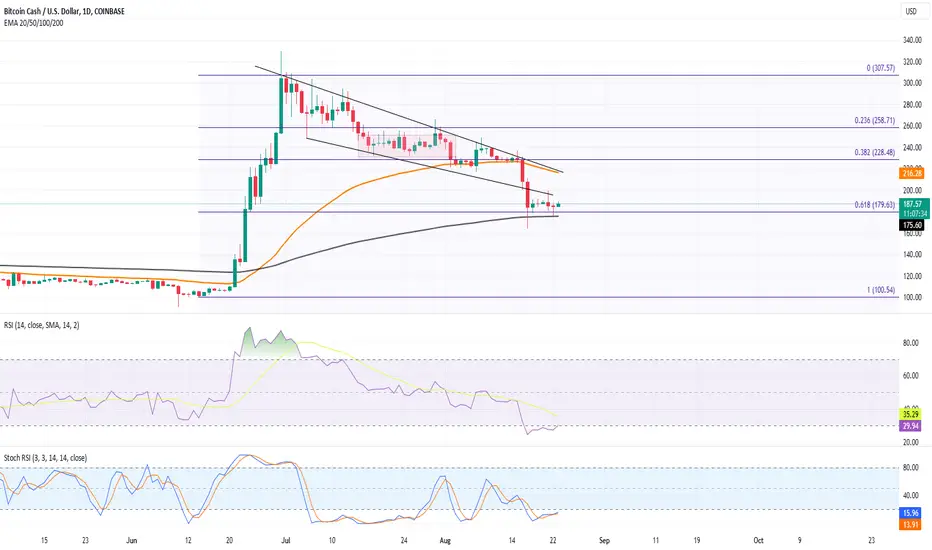
Silver Lining: BCH steadies its price at the 200-day EMA after a significant fall, suggesting a potential solid support and buying zone.
Market Resilience: BCH remains stable over the past week, largely unaffected by the broader market sell-off.
Key Support Levels: Both the 200-day EMA and the 61.80% Fibonacci level at $180 indicate strong investor confidence in BCH.
YTD Gains: BCH boasts an impressive 96% year-to-date gain, outperforming many major altcoins.
Decline from Peak: A 42% decline from its 2023 peak raises questions about BCH's future trajectory.
Technical Indicators: The daily chart's Stochastic RSI and RSI hint at a potential comeback from oversold conditions.
4H Chart Analysis: A double bottom pattern seems to form around $180, with a $190 neckline, suggesting a bullish trend.
Bullish Divergence: The 4H RSI shows a bullish divergence, increasing the likelihood of a positive breakout.
Potential Reversal: Technical signs point to BCH preparing for a reversal, possibly surpassing the $200 mark and aiming for $228 (the 38.20% Fibonacci level).
Downside Risk: If BCH dips below $175, it could further decline towards $150.
免責聲明
這些資訊和出版物並不意味著也不構成TradingView提供或認可的金融、投資、交易或其他類型的意見或建議。請在使用條款閱讀更多資訊。
免責聲明
這些資訊和出版物並不意味著也不構成TradingView提供或認可的金融、投資、交易或其他類型的意見或建議。請在使用條款閱讀更多資訊。