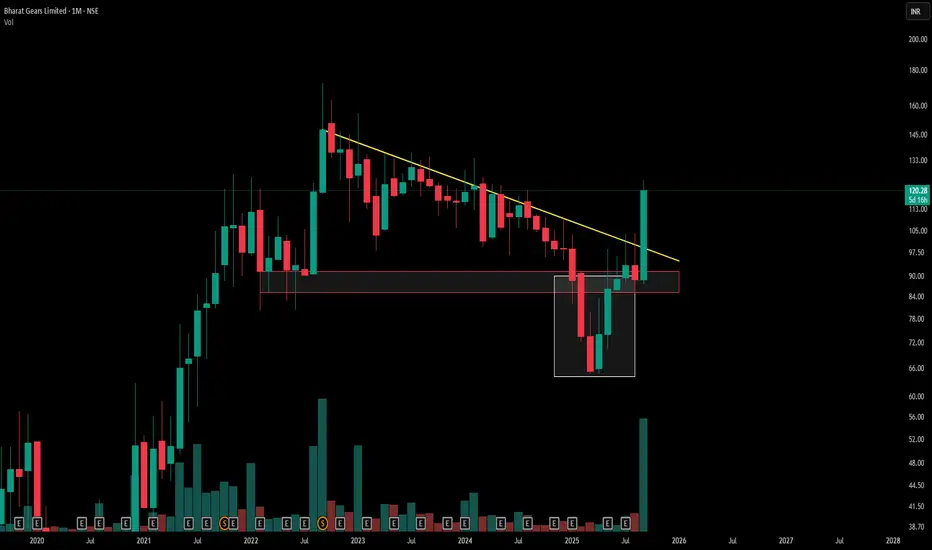
A descending triangle on the monthly chart shows lower highs converging toward a flat support, reflecting mounting seller pressure and key institutional interest at the horizontal base
The red counter trendline highlights corrective rallies within the broader down-sloping resistance.
The red demand zone marks where significant buying absorbed prior declines, offering a structural support area.
The white box illustrates a false breakdown below support—a liquidity-grab that shook out weak hands before a swift recovery—demonstrating how professional traders engineer stop-hunts to secure favorable entry levels.
This interplay of pattern, trendlines, demand zone, and false breakdown underscores how market structure and institutional tactics shape price action—key for informed, risk-defined decisions.
Disclaimer: For educational purposes only. Not investment advice. Risk management and independent research are vital.
🎯 Master My Self-Made Trading Strategy
📈 Telegram (Learn Today): t.me/hashtaghammer
✅ WhatsApp (Learn Today): wa.me/919455664601
📈 Telegram (Learn Today): t.me/hashtaghammer
✅ WhatsApp (Learn Today): wa.me/919455664601
相關出版品
免責聲明
這些資訊和出版物並不意味著也不構成TradingView提供或認可的金融、投資、交易或其他類型的意見或建議。請在使用條款閱讀更多資訊。
🎯 Master My Self-Made Trading Strategy
📈 Telegram (Learn Today): t.me/hashtaghammer
✅ WhatsApp (Learn Today): wa.me/919455664601
📈 Telegram (Learn Today): t.me/hashtaghammer
✅ WhatsApp (Learn Today): wa.me/919455664601
相關出版品
免責聲明
這些資訊和出版物並不意味著也不構成TradingView提供或認可的金融、投資、交易或其他類型的意見或建議。請在使用條款閱讀更多資訊。