📊 BIRLA CABLE LTD (BIRLACABLE) – Cup & Handle Breakout with Fibonacci Targets | RSI Overbought | Volume Spike | Daily Chart
📅 Chart Date: June 18, 2025
📈 CMP: ₹208.05 (+14.11%)
📍 Ticker: NSE:BIRLACABLE
🔍 Technical Chart Breakdown
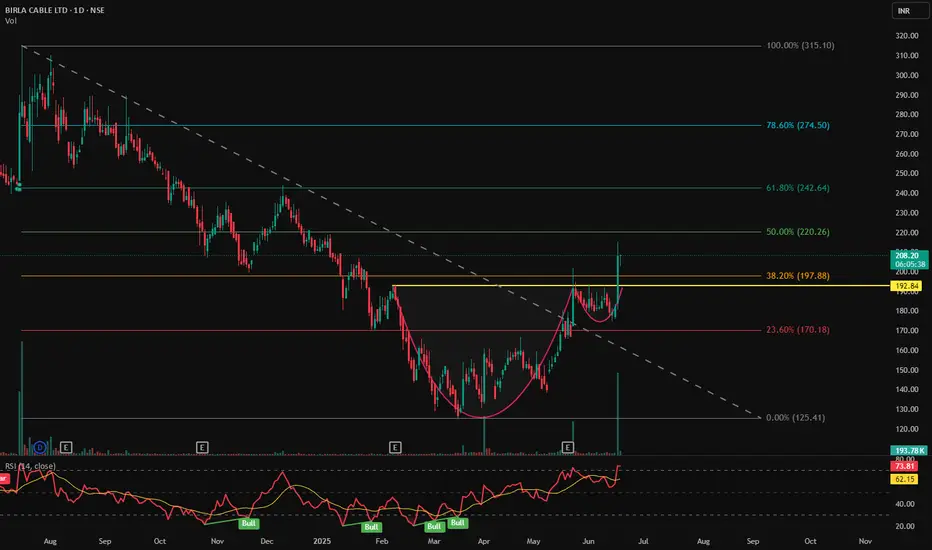
☕ Cup & Handle Pattern Breakout
BIRLACABLE has confirmed a Cup & Handle breakout above the neckline at ₹197.88 (also 38.2% Fibonacci retracement level), suggesting bullish continuation after a long consolidation. The breakout is clean with a wide bullish candle.
📐 Fibonacci Retracement Levels (from swing high ₹315.10 to swing low ₹125.41)
38.2% (Breakout Zone): ₹197.88 ✅
50.0%: ₹220.26
61.8%: ₹242.64
78.6%: ₹274.50
Target: 100% Fibonacci: ₹315+
💹 RSI & Momentum
RSI at 73.75, entering overbought territory 🔼
Multiple RSI bullish crossovers visible during base formation
RSI suggests strong buying momentum, ideal for trend continuation
📉 Trendline Breakout
Downtrend resistance (dotted line) broken along with horizontal neckline
Aligns with volume-based breakout, confirming strength
🕯️ Volume Confirmation
Huge spike in volume (4.44M) on breakout day — highest in months
Suggests institutional or smart money activity
📍 Key Price Levels
✅ Breakout Level: ₹197.88
🚀 Fibonacci Targets:
₹220.26 → 50%
₹242.64 → 61.8%
₹274.50 → 78.6%
₹315+ → 100% (Full target)
🛡️ Support Levels:
₹197 (neckline support)
₹170.18 (23.6% Fib)
₹150 (handle base)
💡 Trading Idea
Entry: Close above ₹198 or on retest of neckline
Stop Loss: Below ₹185 or ₹170
Targets: ₹220 → ₹243 → ₹275 → ₹315
Risk-Reward: Favorable with strong confirmation
📅 Chart Date: June 18, 2025
📈 CMP: ₹208.05 (+14.11%)
📍 Ticker: NSE:BIRLACABLE
🔍 Technical Chart Breakdown
☕ Cup & Handle Pattern Breakout
BIRLACABLE has confirmed a Cup & Handle breakout above the neckline at ₹197.88 (also 38.2% Fibonacci retracement level), suggesting bullish continuation after a long consolidation. The breakout is clean with a wide bullish candle.
📐 Fibonacci Retracement Levels (from swing high ₹315.10 to swing low ₹125.41)
38.2% (Breakout Zone): ₹197.88 ✅
50.0%: ₹220.26
61.8%: ₹242.64
78.6%: ₹274.50
Target: 100% Fibonacci: ₹315+
💹 RSI & Momentum
RSI at 73.75, entering overbought territory 🔼
Multiple RSI bullish crossovers visible during base formation
RSI suggests strong buying momentum, ideal for trend continuation
📉 Trendline Breakout
Downtrend resistance (dotted line) broken along with horizontal neckline
Aligns with volume-based breakout, confirming strength
🕯️ Volume Confirmation
Huge spike in volume (4.44M) on breakout day — highest in months
Suggests institutional or smart money activity
📍 Key Price Levels
✅ Breakout Level: ₹197.88
🚀 Fibonacci Targets:
₹220.26 → 50%
₹242.64 → 61.8%
₹274.50 → 78.6%
₹315+ → 100% (Full target)
🛡️ Support Levels:
₹197 (neckline support)
₹170.18 (23.6% Fib)
₹150 (handle base)
💡 Trading Idea
Entry: Close above ₹198 or on retest of neckline
Stop Loss: Below ₹185 or ₹170
Targets: ₹220 → ₹243 → ₹275 → ₹315
Risk-Reward: Favorable with strong confirmation
交易結束:達到停損點
免責聲明
這些資訊和出版物並非旨在提供,也不構成TradingView提供或認可的任何形式的財務、投資、交易或其他類型的建議或推薦。請閱讀使用條款以了解更多資訊。
免責聲明
這些資訊和出版物並非旨在提供,也不構成TradingView提供或認可的任何形式的財務、投資、交易或其他類型的建議或推薦。請閱讀使用條款以了解更多資訊。