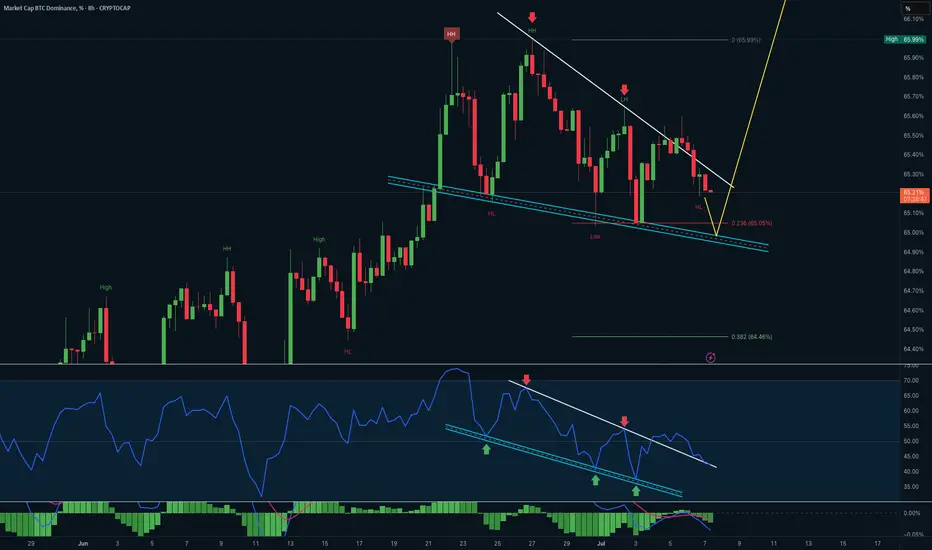
This 8H BTC.D chart is showing signs of a potential bullish reversal setup within a falling wedge, supported by RSI channel divergence and MACD structure.
Price Action:
• BTC.D is compressing within a falling wedge, marked by lower highs and higher lows.
• Price is currently near the lower boundary of the wedge, with confluence at the 0.236 Fibonacci level (65.05%) and historical HL zone.
• A break above the wedge resistance would signal trend reversal or continuation toward 66% - 67%.
RSI Momentum:
• RSI mirrors price by forming a descending channel, with multiple bullish bounces at lower support.
• Repeated touches on the lower band suggest momentum divergence building from oversold conditions.
• A break of RSI’s trendline would confirm bullish shift ahead of price breakout.
MACD Histogram:
• Flattening after bearish pressure, signaling that sellers may be losing momentum.
• Watch for cross up to accompany price breakout for stronger confirmation.
📌 Key Takeaways:
• Bullish reversal potential building within wedge
• RSI showing leading divergence from price
• Break above 65.5% zone could trigger a move to 66.0%–66.3%
• Breakdown of wedge invalidates the structure → next support: 64.46%
免責聲明
這些資訊和出版物並不意味著也不構成TradingView提供或認可的金融、投資、交易或其他類型的意見或建議。請在使用條款閱讀更多資訊。