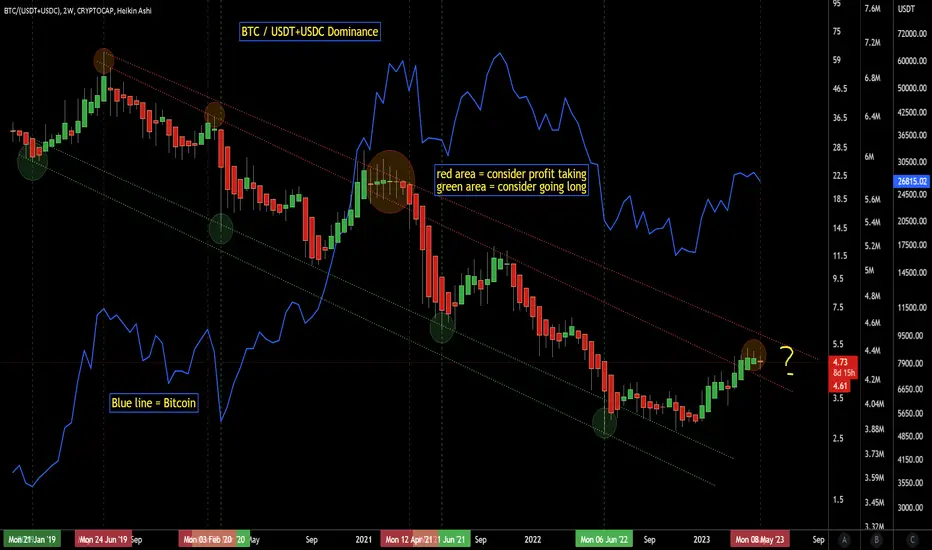
This is a Bitcoin chart divided by the USDT and USDC stablecoin charts. It gives unique results and seems to work well for finding approximate tops and bottoms.
Upper red zone take profits. Lower green zone go long. Blue line is historical bitcoin price action since 2019.
Upper red zone take profits. Lower green zone go long. Blue line is historical bitcoin price action since 2019.
免責聲明
這些資訊和出版物並不意味著也不構成TradingView提供或認可的金融、投資、交易或其他類型的意見或建議。請在使用條款閱讀更多資訊。