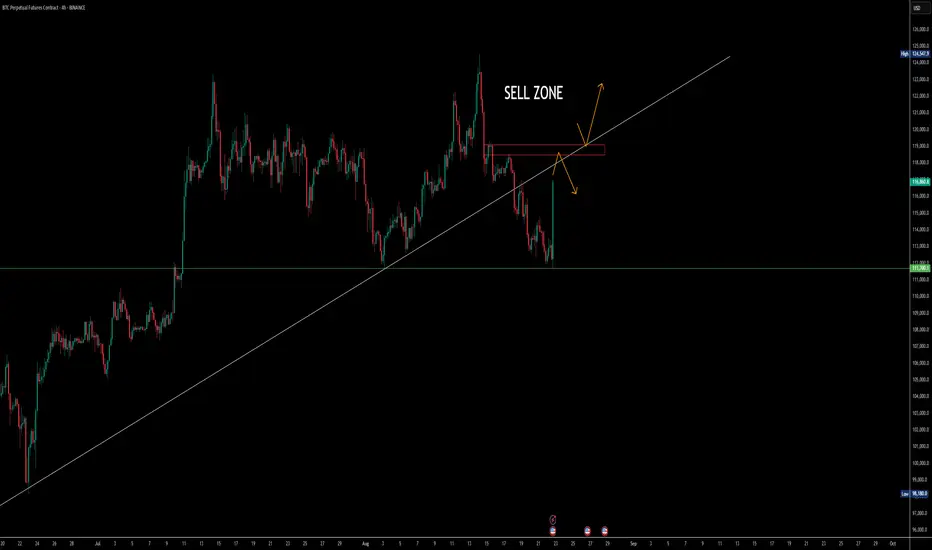
On the 4H chart, BTC recently showed a clear bullish divergence that sparked an upward move. The current structure points toward a favorable liquidity zone between 120k and 118k, but the real test lies at the 122k level. If BTC can hold above 122k, momentum could continue, but failure to sustain will likely bring a rejection back near 119k. With the weekend approaching and typical sell pressure often kicking in around Monday or Tuesday, traders should stay cautious. Longs from lower levels are looking good, but this is not the moment to expect a fresh all-time high. Watch the liquidity flips and manage positions carefully.
FOLLOW MY TELEGRAM CHANNEL FOR FREE : bit.ly/3JfrpgV
免責聲明
這些資訊和出版物並不意味著也不構成TradingView提供或認可的金融、投資、交易或其他類型的意見或建議。請在使用條款閱讀更多資訊。
FOLLOW MY TELEGRAM CHANNEL FOR FREE : bit.ly/3JfrpgV
免責聲明
這些資訊和出版物並不意味著也不構成TradingView提供或認可的金融、投資、交易或其他類型的意見或建議。請在使用條款閱讀更多資訊。