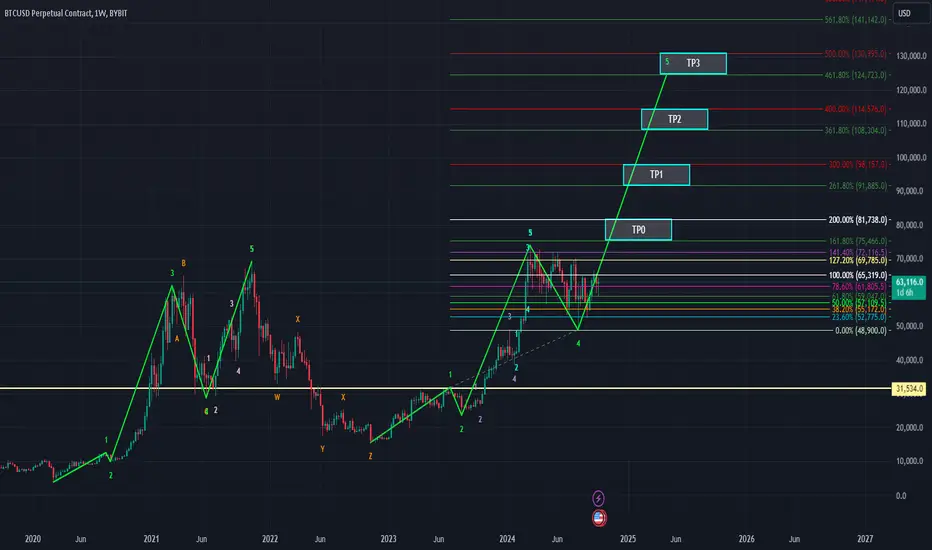
In this chart, we observe a clear Elliott Wave structure with five impulsive waves, indicating a potential bullish continuation. The Fibonacci extensions are plotted, highlighting possible Take Profit (TP) levels based on the wave projections.
Wave 1 to 5 completed, with Wave 5 potentially leading to significant price growth.
The Fibonacci retracement levels show key support areas, while the Fibonacci extensions suggest potential upside targets.
Key Targets:
TP0: MAX 81,738.0 (168% - 200% Fibonacci)
TP1: MAX 98,157.0 (261% - 300% Fibonacci)
TP2: MAX 114,576.0 (361% - 400% Fibonacci)
TP3: MAX 130,995.0 (461% - 500% Fibonacci)
The current price action is in consolidation, suggesting a breakout may occur soon. A strong move past TP0 could accelerate the upward momentum towards the higher TP levels.
Keep an eye on support levels around 63,068.0 and potential correction zones before a breakout occurs.
Disclaimer: This is just my personal view based on technical analysis, and it is not financial advice. Please conduct your own research and trade responsibly!
免責聲明
這些資訊和出版物並非旨在提供,也不構成TradingView提供或認可的任何形式的財務、投資、交易或其他類型的建議或推薦。請閱讀使用條款以了解更多資訊。
免責聲明
這些資訊和出版物並非旨在提供,也不構成TradingView提供或認可的任何形式的財務、投資、交易或其他類型的建議或推薦。請閱讀使用條款以了解更多資訊。