🔎 Technical Narrative & Market Structure Analysis
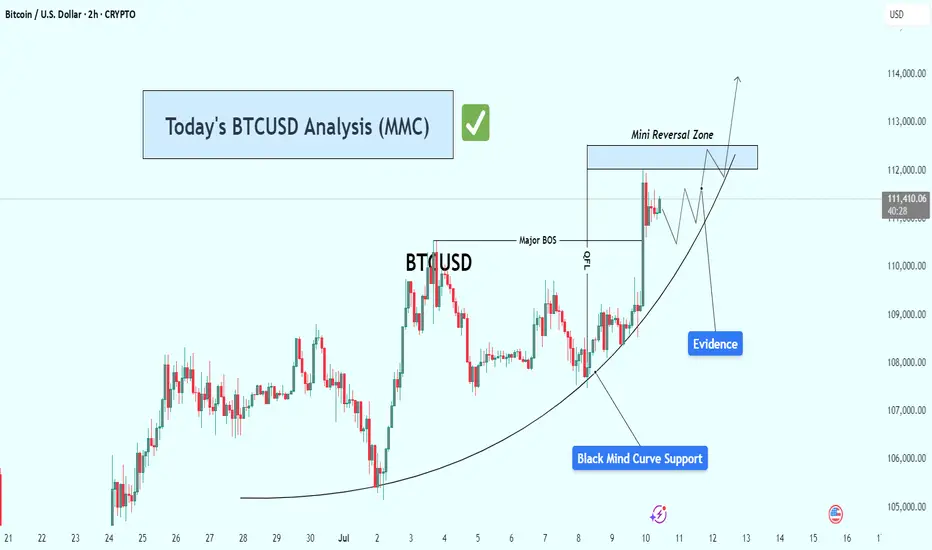
Bitcoin is currently respecting a textbook parabolic support structure represented by the Black Mind Curve—a dynamic visual model reflecting the psychology of crowd behavior transitioning from uncertainty to confidence. This curved structure often precedes strong bullish continuation patterns, especially when paired with evidence of smart money involvement.
The current price action shows sequential higher lows, each of which is supported directly by the Mind Curve. These bounces confirm demand stepping in consistently at higher levels, a strong sign of controlled accumulation and momentum building.
🧠 Key Chart Components Explained
✅ 1. Mind Curve (Dynamic Support)
A custom-drawn parabolic curve reflects the ongoing upward force from buyers.
Bitcoin has tested and bounced from this curve multiple times, showing it is respected by market participants.
As price hugs the curve more tightly, the compression could lead to a volatility breakout.
✅ 2. Major BOS (Break of Structure)
A significant market structure break occurred as price took out a previous swing high.
This BOS confirms a shift in market sentiment from ranging/sideways to uptrend formation.
The BOS now acts as a reference point for bullish momentum and could serve as support on a potential retest.
✅ 3. QFL Zone (Quantity following line )
Located just below the BOS, this zone marks the last area where aggressive buyers stepped in before the breakout.
These levels are often defended on a retest and are used by institutional traders to re-enter positions.
✅ 4. Evidence Candle
This sharp bullish impulse candle is what we call an "evidence candle"—it pierces minor resistances with strength and volume.
It represents institutional-level interest and confirms smart money accumulation.
Such candles typically precede either continuation or minor pullback for re-accumulation.
✅ 5. Reversal Zone (Target Zone)
This zone lies ahead at approximately 112,500 to 113,000, a confluence of previous supply, key psychological level, and potential liquidity pool.
It's the next logical area where price may pause, react, or break through if momentum sustains.
⚔️ Scenarios to Watch
🟩 Bullish Scenario:
Price continues riding the curve support upward.
Breaks and closes above the Reversal Zone, ideally with volume and continuation candle.
Potential upside extension toward 114,000–115,000.
🟨 Neutral/Consolidation Scenario:
Price consolidates just below the Reversal Zone.
May form a flag/pennant or triangle structure.
Bullish continuation likely if the curve holds beneath.
🟥 Bearish/Invalidation Scenario:
Price breaks below the Mind Curve and BOS, closing below with momentum.
This would signal a potential breakdown of the bullish structure.
Invalidation zone likely sits below 110,000, and a breakdown could open room to revisit the 108,500–109,000 area.
📌 Confluence Factors Supporting the Bullish Bias:
Respect of Mind Curve over time = hidden institutional support
Presence of BOS and QFL = structure and order block confluence
Evidence candle = high-volume trigger point
Reversal Zone = logical magnet for price, supported by liquidity and previous reactions
📈 Summary & Trading Thesis
Bitcoin is currently in a bullish microstructure within a larger range. The parabola-style Mind Curve suggests that this structure is maturing toward an inflection point. The break above BOS, evidence of strength, and alignment with demand zones all support a move toward the 112,500–113,000 Reversal Zone. If momentum sustains, this could become the start of a broader bullish leg.
📢 Final Thought:
While the setup is bullish, discipline and patience are key. Watching how price behaves around the Reversal Zone will be critical. A clean breakout or solid rejection will provide the next high-probability signal.
For Daily Trade Setups and Forecast: 📈 t.me/xauusdoptimizer
Premium Signals Fr33: 💯 t.me/xauusdoptimizer
🥰🥳🤩
Premium Signals Fr33: 💯 t.me/xauusdoptimizer
🥰🥳🤩
相關出版品
免責聲明
這些資訊和出版物並不意味著也不構成TradingView提供或認可的金融、投資、交易或其他類型的意見或建議。請在使用條款閱讀更多資訊。
For Daily Trade Setups and Forecast: 📈 t.me/xauusdoptimizer
Premium Signals Fr33: 💯 t.me/xauusdoptimizer
🥰🥳🤩
Premium Signals Fr33: 💯 t.me/xauusdoptimizer
🥰🥳🤩
相關出版品
免責聲明
這些資訊和出版物並不意味著也不構成TradingView提供或認可的金融、投資、交易或其他類型的意見或建議。請在使用條款閱讀更多資訊。