🎯 BTC Hits Predicted 1.618 Fibonacci Target at $122K — What’s Next?
📅 Posted on: July 16, 2025
📍 Ticker: BTCUSD (BINANCE)
✍️ Author: darwas121
⸻
🔹 Summary
In October 2023, I shared a long-term bullish projection for Bitcoin (BTC/USD) targeting the 1.618 Fibonacci extension level — projected around $122,000. As of today, BTC has successfully hit this target, validating the Fibonacci-based wave structure and bull market thesis. Now the key question is — what’s next?
⸻
🧠 Prediction Recap (Oct 2023)
• ✅ Projected rally continuation based on wave structure + Fibonacci expansion
• ✅ Long-term target: $122,056 (1.618 Fib level)
• ✅ Based on swing low near $15,550 and prior ATH structure
• ✅ Conditions: Confirmed breakout above $81,500
⸻
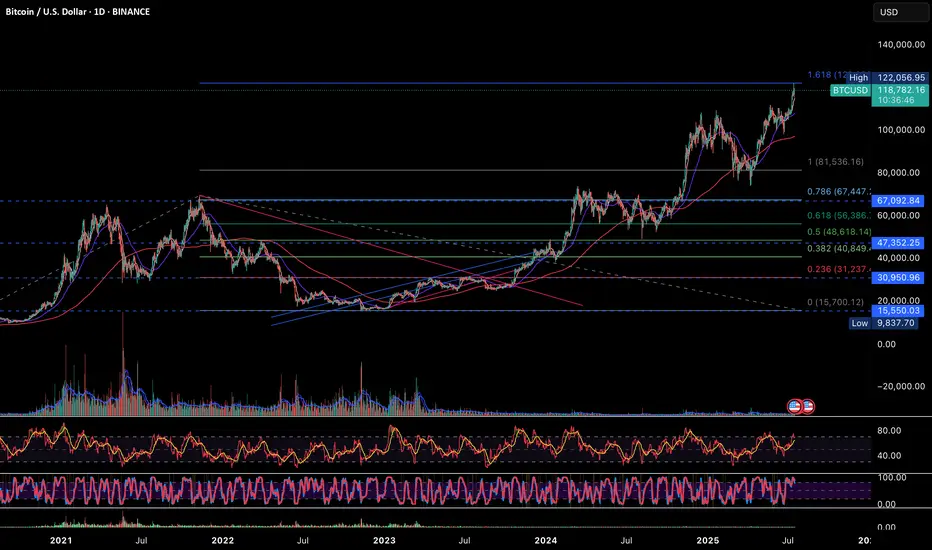
🔍 Current Technical Analysis (1D Chart)
💰 Price Action
• Current Price: $118,701
• Recent High: $122,056 (exact 1.618 Fib hit)
• Structure: Parabolic breakout from previous consolidation range
🔺 Fibonacci Levels
Level Price (USD)
0.236 31,237
0.382 40,849
0.5 48,618
0.618 56,386
0.786 67,092
1.0 (ATH Zone) 81,536
1.618 ✅ 122,056 (Hit)
📉 RSI & Momentum
• RSI is hovering in the overbought zone (>70), signaling potential cooling-off
• Stochastic RSI also indicates overextension — a pause or retracement could follow
• No bearish divergence yet, but watch closely
📊 Volume Trends
• Volume has tapered during this leg up — possible early sign of buyer exhaustion
• Previous volume clusters between $56k–$67k now act as strong support
⸻
⚠️ What to Watch Next
Risk Factors Notes
Overbought RSI Suggests short-term pullback risk
Weakening Volume Caution: Less conviction in highs
Parabolic Structure Vulnerability Break could mean fast correction
⸻
🧭 My View & Strategy
🔹 Short-Term: ⚠️ Cautious
• Book partial profits if holding from lower levels
• Watch for reversal candles near $122k zone
• RSI divergence or low-volume rally = yellow flag
🔹 Mid-Term: 🔼 Bullish
• Buy-the-dip zones: $67k (0.786) and $56k (0.618)
• Any correction into these zones may offer re-entry
🔹 Long-Term: 🔼 Strong Bullish
• BTC is in confirmed macro uptrend
• Sustained close above $122k opens price discovery zone
• Next logical Fib projection zones: $135k–$150k
⸻
📌 Key Levels
• Support: $81,536 / $67,092 / $56,386
• Resistance: $122,056 → Break = price discovery
• Invalidation Zone: Breakdown below $81,000 on volume
⸻
📣 Conclusion
The technical roadmap laid out in 2023 has now played out — Bitcoin has achieved its 1.618 Fibonacci extension target. We are now at a critical inflection point. If BTC consolidates well here and maintains volume, the next leg could launch us into new all-time highs beyond $135,000.
🛑 But caution is warranted — overbought signals + weak volume could bring a healthy correction first. Stick to your risk plan. Let the market come to you.
⸻
💬 Feel free to share your views or ask for updates in the comments.
🔔 Follow me for more swing-to-position analysis using volume, fibs & structure.
📊 Chart shared below for reference.
#Bitcoin #BTCUSD #Crypto #TechnicalAnalysis #Fibonacci #PriceTargets #CryptoForecast #ParabolicMove #BTC
📅 Posted on: July 16, 2025
📍 Ticker: BTCUSD (BINANCE)
✍️ Author: darwas121
⸻
🔹 Summary
In October 2023, I shared a long-term bullish projection for Bitcoin (BTC/USD) targeting the 1.618 Fibonacci extension level — projected around $122,000. As of today, BTC has successfully hit this target, validating the Fibonacci-based wave structure and bull market thesis. Now the key question is — what’s next?
⸻
🧠 Prediction Recap (Oct 2023)
• ✅ Projected rally continuation based on wave structure + Fibonacci expansion
• ✅ Long-term target: $122,056 (1.618 Fib level)
• ✅ Based on swing low near $15,550 and prior ATH structure
• ✅ Conditions: Confirmed breakout above $81,500
⸻
🔍 Current Technical Analysis (1D Chart)
💰 Price Action
• Current Price: $118,701
• Recent High: $122,056 (exact 1.618 Fib hit)
• Structure: Parabolic breakout from previous consolidation range
🔺 Fibonacci Levels
Level Price (USD)
0.236 31,237
0.382 40,849
0.5 48,618
0.618 56,386
0.786 67,092
1.0 (ATH Zone) 81,536
1.618 ✅ 122,056 (Hit)
📉 RSI & Momentum
• RSI is hovering in the overbought zone (>70), signaling potential cooling-off
• Stochastic RSI also indicates overextension — a pause or retracement could follow
• No bearish divergence yet, but watch closely
📊 Volume Trends
• Volume has tapered during this leg up — possible early sign of buyer exhaustion
• Previous volume clusters between $56k–$67k now act as strong support
⸻
⚠️ What to Watch Next
Risk Factors Notes
Overbought RSI Suggests short-term pullback risk
Weakening Volume Caution: Less conviction in highs
Parabolic Structure Vulnerability Break could mean fast correction
⸻
🧭 My View & Strategy
🔹 Short-Term: ⚠️ Cautious
• Book partial profits if holding from lower levels
• Watch for reversal candles near $122k zone
• RSI divergence or low-volume rally = yellow flag
🔹 Mid-Term: 🔼 Bullish
• Buy-the-dip zones: $67k (0.786) and $56k (0.618)
• Any correction into these zones may offer re-entry
🔹 Long-Term: 🔼 Strong Bullish
• BTC is in confirmed macro uptrend
• Sustained close above $122k opens price discovery zone
• Next logical Fib projection zones: $135k–$150k
⸻
📌 Key Levels
• Support: $81,536 / $67,092 / $56,386
• Resistance: $122,056 → Break = price discovery
• Invalidation Zone: Breakdown below $81,000 on volume
⸻
📣 Conclusion
The technical roadmap laid out in 2023 has now played out — Bitcoin has achieved its 1.618 Fibonacci extension target. We are now at a critical inflection point. If BTC consolidates well here and maintains volume, the next leg could launch us into new all-time highs beyond $135,000.
🛑 But caution is warranted — overbought signals + weak volume could bring a healthy correction first. Stick to your risk plan. Let the market come to you.
⸻
💬 Feel free to share your views or ask for updates in the comments.
🔔 Follow me for more swing-to-position analysis using volume, fibs & structure.
📊 Chart shared below for reference.
#Bitcoin #BTCUSD #Crypto #TechnicalAnalysis #Fibonacci #PriceTargets #CryptoForecast #ParabolicMove #BTC
免責聲明
這些資訊和出版物並不意味著也不構成TradingView提供或認可的金融、投資、交易或其他類型的意見或建議。請在使用條款閱讀更多資訊。