It looks like Bitcoin has entered the large consolidation period. It could take some time to evolve.
Wave A down was quick and strong and it could be over.
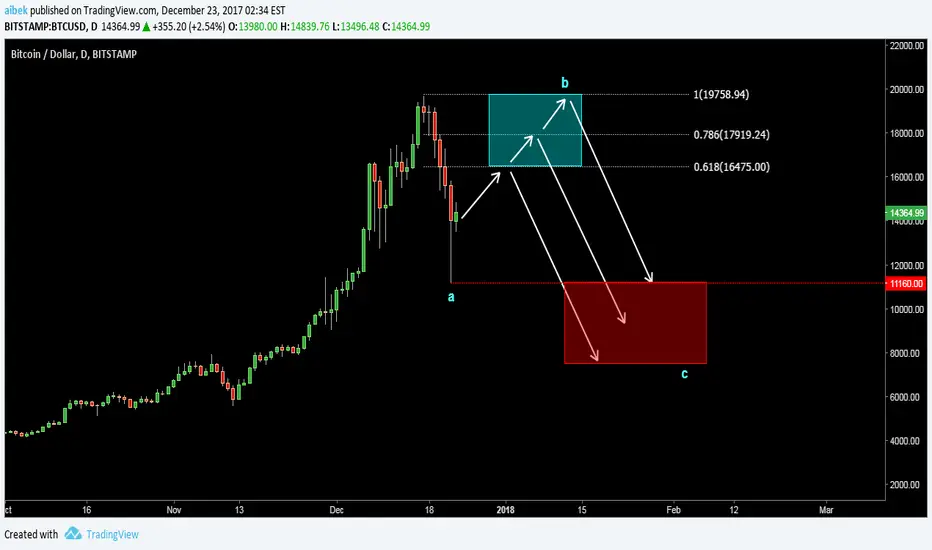
Now there should be the wave B correction of wave A and I highlighted the potential area of retracement with blue rectangle.
After it finishes we can see another dip in the wave C at least to the low of the wave A at 11160 level.
The projection for wave C should be recalculated once the wave B is done. Meanwhile it is highlighted with the red rectangle.
Wave A down was quick and strong and it could be over.
Now there should be the wave B correction of wave A and I highlighted the potential area of retracement with blue rectangle.
After it finishes we can see another dip in the wave C at least to the low of the wave A at 11160 level.
The projection for wave C should be recalculated once the wave B is done. Meanwhile it is highlighted with the red rectangle.
註釋
Countertrend consolidation within a large correction, Last wave up is underway.It can hit anywhere between 15900 and 18600 and then drop.
交易結束:目標達成
免責聲明
這些資訊和出版物並非旨在提供,也不構成TradingView提供或認可的任何形式的財務、投資、交易或其他類型的建議或推薦。請閱讀使用條款以了解更多資訊。