Model Type: Proprietary Market Forecasting Model
Asset: Bitcoin (BTC)
Phases Covered:
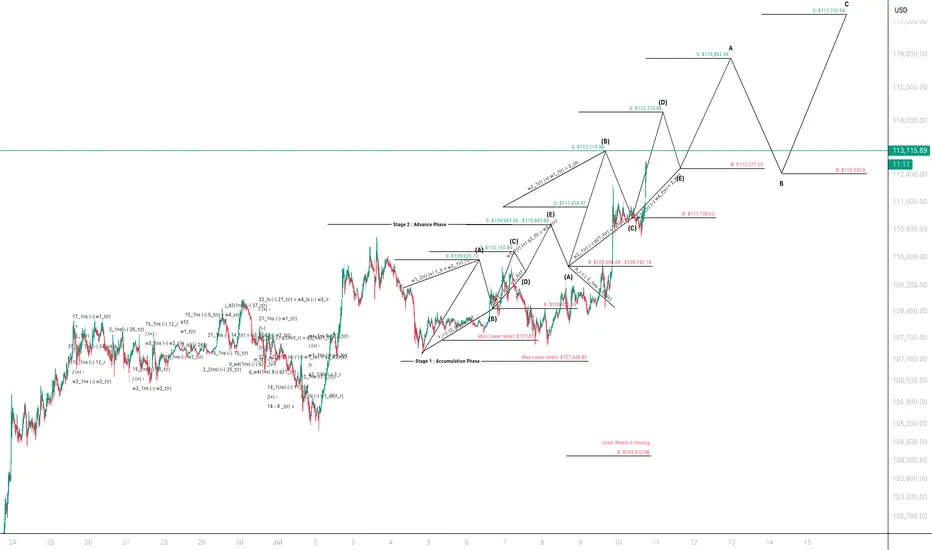
• Stage 1: Accumulation Phase
• Stage 2: Advance Phase
✅ Levels Completed
Level 1: Accumulation Phase Initiation
• Structure identified with a clear base formation.
• Price established a bottom around $107,046.85, narrowly missing the lower retest.
• Confirmed bullish reversal through July , Week 1 and Week2 structure completion.
Level 2: Early Breakout
• Marked by breakout above resistance at $109,925.73.
• Price pushed through to $110,160.94, validating the early advance.
• Completion of Week 2 of July indicating internal structure support.
Level 3: Mid-Cycle Rally
• Bullish continuation toward $110,943.69 and $111,456.97.
• Structure (C)-(D)-(E) confirms strong wave symmetry and market acceptance.
• Brief consolidation validated by backtest zones at $108,535.49 and $107,637.
Level 4: Expansion Phase
• Market continued to rally into $113,114.94, achieving projected top for (B).
• Retested support at $111,456.97, forming a new bullish foundation.
• Completion of Previous Month , Week 4 confirms higher - order fractal alignment.
Level 5: Distribution Setup
Price retested and reclaimed critical breakout zones:
• $109,598.69, $109,742.14, and $111,138.52.
• Completed fractal (C)-(E) cycle toward macro level (B).
• Finalised market structure transition from advance into early distribution.
🔍 Key Support & Resistance Levels
Support Zones (S):
• $109,925.73
• $110,160.94
• $110,943.69
• $111,456.97
Breakout Zones (B):
• $108,535.49
• $109,598.69
• $109,742.14
• $111,138.52
• $112,577.20
Missed Retests:
• $107,637
• $107,046.85
📌 Summary:
The BTC forecast published on July 5th has successfully completed Levels 1 through 5, with all key structural checkpoints met. The market followed the projected model fractals with high accuracy, including complex Week 1 & week2 structures covering June period, ABC-E corrections, and internal retests. This confirms the model’s live execution integrity and further solidifies its reliability for Q3 distribution forecasting.
Disclaimer: The following forecast is derived from a proprietary, hand-crafted mathematical model developed independently over several years. It does not rely on traditional indicators, technical patterns, or third-party frameworks such as Elliott Wave Theory.
This model calculates price action based on distribution phases, economic timing cycles, and natural market imbalances.
#BTC /USD #Market Structure #Cycle Analysis #Quant Model#Technical Outlook.
Asset: Bitcoin (BTC)
Phases Covered:
• Stage 1: Accumulation Phase
• Stage 2: Advance Phase
✅ Levels Completed
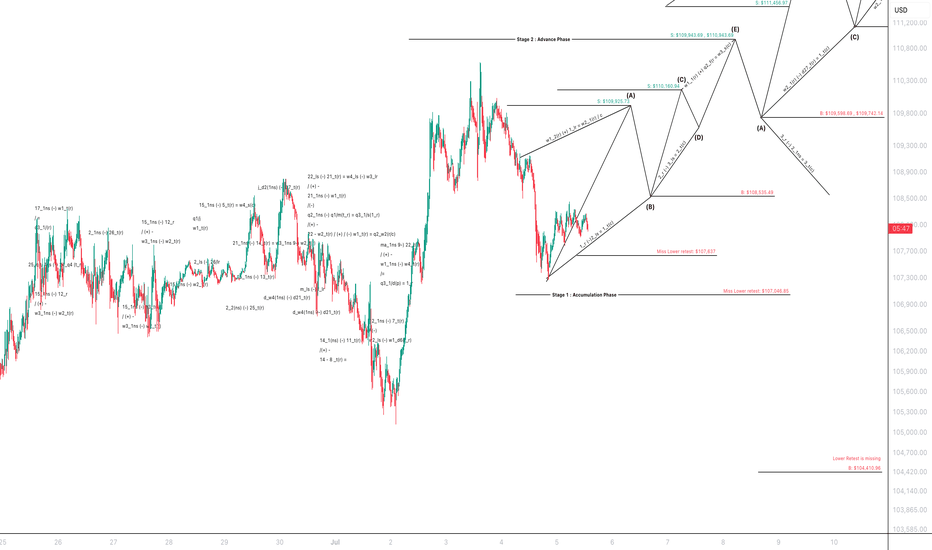
Level 1: Accumulation Phase Initiation
• Structure identified with a clear base formation.
• Price established a bottom around $107,046.85, narrowly missing the lower retest.
• Confirmed bullish reversal through July , Week 1 and Week2 structure completion.
Level 2: Early Breakout
• Marked by breakout above resistance at $109,925.73.
• Price pushed through to $110,160.94, validating the early advance.
• Completion of Week 2 of July indicating internal structure support.
Level 3: Mid-Cycle Rally
• Bullish continuation toward $110,943.69 and $111,456.97.
• Structure (C)-(D)-(E) confirms strong wave symmetry and market acceptance.
• Brief consolidation validated by backtest zones at $108,535.49 and $107,637.
Level 4: Expansion Phase
• Market continued to rally into $113,114.94, achieving projected top for (B).
• Retested support at $111,456.97, forming a new bullish foundation.
• Completion of Previous Month , Week 4 confirms higher - order fractal alignment.
Level 5: Distribution Setup
Price retested and reclaimed critical breakout zones:
• $109,598.69, $109,742.14, and $111,138.52.
• Completed fractal (C)-(E) cycle toward macro level (B).
• Finalised market structure transition from advance into early distribution.
🔍 Key Support & Resistance Levels
Support Zones (S):
• $109,925.73
• $110,160.94
• $110,943.69
• $111,456.97
Breakout Zones (B):
• $108,535.49
• $109,598.69
• $109,742.14
• $111,138.52
• $112,577.20
Missed Retests:
• $107,637
• $107,046.85
📌 Summary:
The BTC forecast published on July 5th has successfully completed Levels 1 through 5, with all key structural checkpoints met. The market followed the projected model fractals with high accuracy, including complex Week 1 & week2 structures covering June period, ABC-E corrections, and internal retests. This confirms the model’s live execution integrity and further solidifies its reliability for Q3 distribution forecasting.
Disclaimer: The following forecast is derived from a proprietary, hand-crafted mathematical model developed independently over several years. It does not rely on traditional indicators, technical patterns, or third-party frameworks such as Elliott Wave Theory.
This model calculates price action based on distribution phases, economic timing cycles, and natural market imbalances.
#BTC /USD #Market Structure #Cycle Analysis #Quant Model#Technical Outlook.
Institutional Note:
For institutional review, independent verification, or strategic collaboration:
institutions@bmoses.com.au
For institutional review, independent verification, or strategic collaboration:
institutions@bmoses.com.au
免責聲明
這些資訊和出版物並不意味著也不構成TradingView提供或認可的金融、投資、交易或其他類型的意見或建議。請在使用條款閱讀更多資訊。