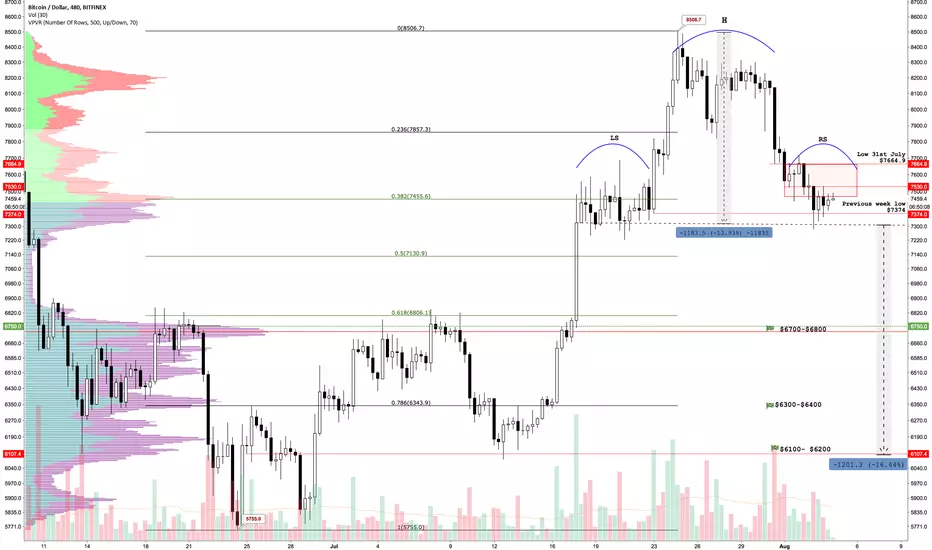
A possible H&S in Bitcoin
註釋
Possible Head And Shoulders If the volume of the RS (which is in formation) is decreasing
and lower than the LS and H could be indicative that
the pattern is being completed.
Neckline $ 7300 - $ 7310
A pattern is not a pattern until it is completed and the
Its morphology is always a possibility.
註釋
The neckline is being tested 註釋
If the price can not overpass the neckline in the upward direction is considered broken.註釋
Broken support flips into resistance 註釋
The breakdown was https://fast...https://www.tradingview.com/x/GqRBTW6p/註釋
The prices could find support in the 50MA around $6900 for a wee bounce 註釋
50MA daily註釋
The price has found support around 50MA daily. Maybe a sideways trend for a couple of hours before the next move. I draw a descending channel, the centre line is S/R zone.註釋
The downtrend is overextended...likely a wee bounce註釋
Good morning to everyoneThe price still in a sideways trend and bullish divergence starts to appear.
The channel's lower band is working well as support
註釋
The channel's centre line is resistance zone (S/R)註釋
Not much. The price is weak to bounce. 註釋
The price has had a wee bounce 註釋
Chart BTCUSD 3H. The magenta line is the 18MA, this moving average has been being a drive for the downward.
註釋
The channel's centre line has been being good support...註釋
The price is recovering. The chart shows Fibonacci and S/R註釋
The initial TP of H&S is $6100 and still in play註釋
The resistance at $7150 did its work 註釋
This is what has been happening the last 30 days 註釋
Guys..if you like this idea give me a thumbs up! Thanks in advances
交易結束:目標達成
The initial target was reached $6100 - $6200 免責聲明
這些資訊和出版物並不意味著也不構成TradingView提供或認可的金融、投資、交易或其他類型的意見或建議。請在使用條款閱讀更多資訊。
免責聲明
這些資訊和出版物並不意味著也不構成TradingView提供或認可的金融、投資、交易或其他類型的意見或建議。請在使用條款閱讀更多資訊。