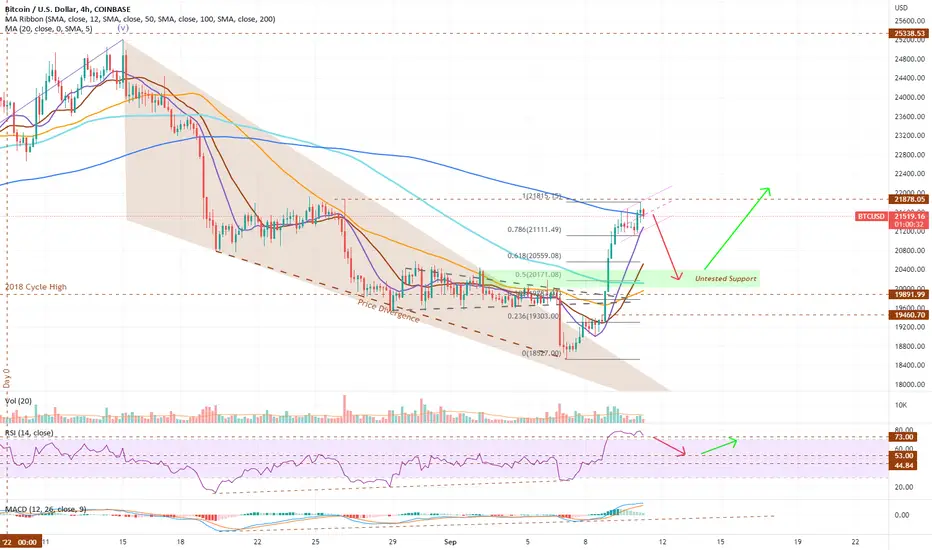
Throughout the course of this bear market in Bitcoin and since the All-time High was set at $69k on November 10, 2021, the RSI in the 4-hr chart has 7 times exceeded the 73 level in the over-bought region. On the past 6 occurrences this indicator pulled back to under 30 and into the oversold territory. In this latest occurrence, price is hovering precariously in the over-bought region and one could be forgiven for thinking it is defying gravity at the moment.
Further, in the process of making this major break over the past few days (17.75% from September 7) price has not paused to test and confirm past levels of resistance as support. Specifically, the zone between $20.5k and $20k contains a number of levels of past resistance that were passed over.
It would seem that price must correct in the short-term to normalise the over-bought condition, to confirm prior levels of resistance as support, and if you are bullish, to provide the overall conditions and confidence for more price appreciation.
A move back to test this $20k level would be a 50% correction of the recent rally and potentially bring the RSI back to the confirm a level of support inherent in its chart at around 53.
Is it only a matter of time before price corrects and the RSI drops down from these lofty heights and support is confirmed?
相關出版品
免責聲明
這些資訊和出版物並不意味著也不構成TradingView提供或認可的金融、投資、交易或其他類型的意見或建議。請在使用條款閱讀更多資訊。