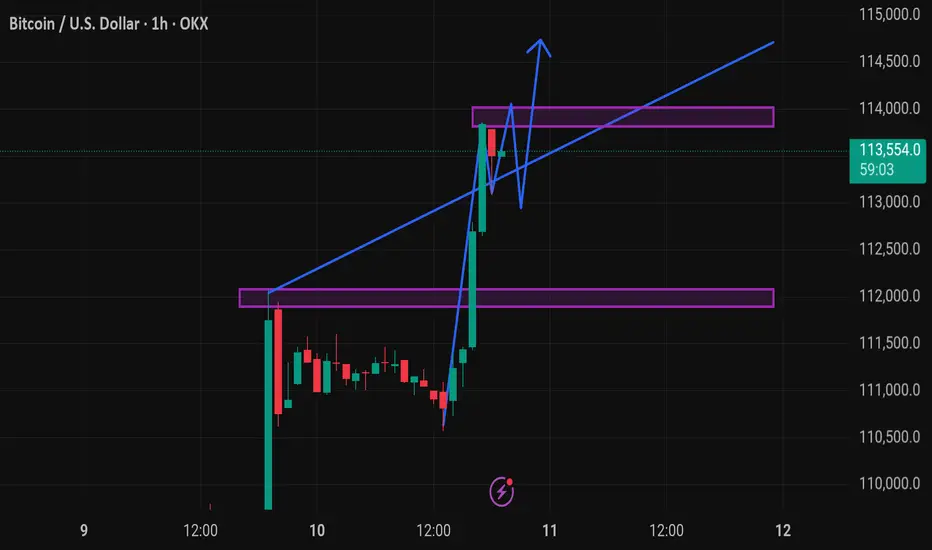
This chart represents the Bitcoin (BTC) / USD price action on a 1-hour timeframe, with technical analysis indicators suggesting a bullish outlook.
Key Elements in the Chart:
1. Current Price:
BTC is trading at $113,506.5, up +1.98% on the 1-hour chart.
2. Support and Resistance Zones:
Support Zone (purple box around ~$112,000): Recently tested and held, now acting as a potential base.
Resistance Zone (purple box around ~$113,800 to ~$114,000): Price is currently consolidating just below this zone.
3. Trendline:
A rising blue trendline is acting as dynamic support, showing upward momentum.
4. Projected Price Action (Blue Arrow Path):
The blue path suggests a potential bullish breakout from the resistance zone.
Implies consolidation, retest of support/trendline, and continuation upward—a common bullish flag or pennant pattern.
---
Interpretation:
The chart setup is bullish, expecting:
Retest of support near $113,200–$113,400
Break above the $114,000 resistance
Potential rally continuation beyond $114,000 (toward $115,000 or more)
Caution:
If BTC fails to hold the trendline or drops below the support zone (~$112,000), this bullish setup may be invalidated.
Would you like a trading strategy (e.g., entry/exit levels or risk management) based on this setup?
🎯XAUUSD GOLD Daily 8-9 Free Signals🚀 World Best community Join Here ✅
💫XAUUSD
💫BTC
💫EURUSD
For Signals Telegram channel
⬇️⬇️⬇️⬇️⬇️⬇️⬇️⬇️⬇️⬇️⬇️⬇️⬇️
t.me/technicaltrader10
💫XAUUSD
💫BTC
💫EURUSD
For Signals Telegram channel
⬇️⬇️⬇️⬇️⬇️⬇️⬇️⬇️⬇️⬇️⬇️⬇️⬇️
t.me/technicaltrader10
免責聲明
這些資訊和出版物並不意味著也不構成TradingView提供或認可的金融、投資、交易或其他類型的意見或建議。請在使用條款閱讀更多資訊。