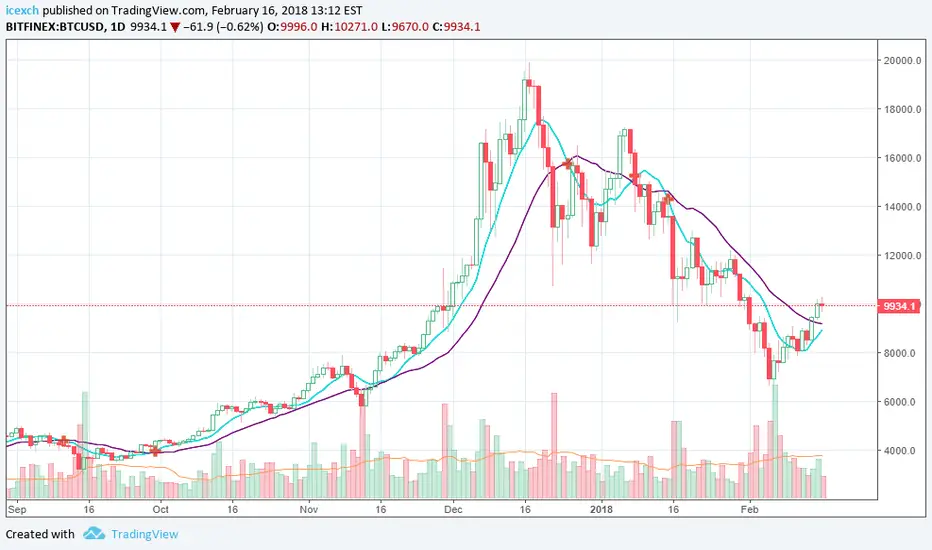
Bitcoin rebounded quite convincingly from the slow moving average on the weekly chart (about $ 6,000) and was now able to climb above the slow average of the daily chart. Having already reached the resistance levels at $ 10,000- $ 12,000.
If the rate remains above $ 9,500 for a couple of days, we will receive a buy signal from the Moving Average of the daily chart. Most likely it will happen because it already happened on the graphs of many other coins.
Should we follow this signal and buy?
Now it seems reasonable to wait another week and that's why:
- The first reversal signal from the trend indicators is often false and the real reverse happens after the rate bounces back and then a re-signal comes in.
- If the signal is false, the price will not stay above the weekly average, based on my experience. If it does, the probability of the signal being true will increase significantly.
- Bitcoin went into the resistance zone and now a correction down is very likely.
- the volume of trading on the rise to $ 10,000 is much lower than on the decline to $ 6,000. This means that the fall was a trend movement, and growth was the corrective.
So, signs of a reversal trend appeared, but we recommend waiting another week before making decisions.
免責聲明
這些資訊和出版物並不意味著也不構成TradingView提供或認可的金融、投資、交易或其他類型的意見或建議。請在使用條款閱讀更多資訊。