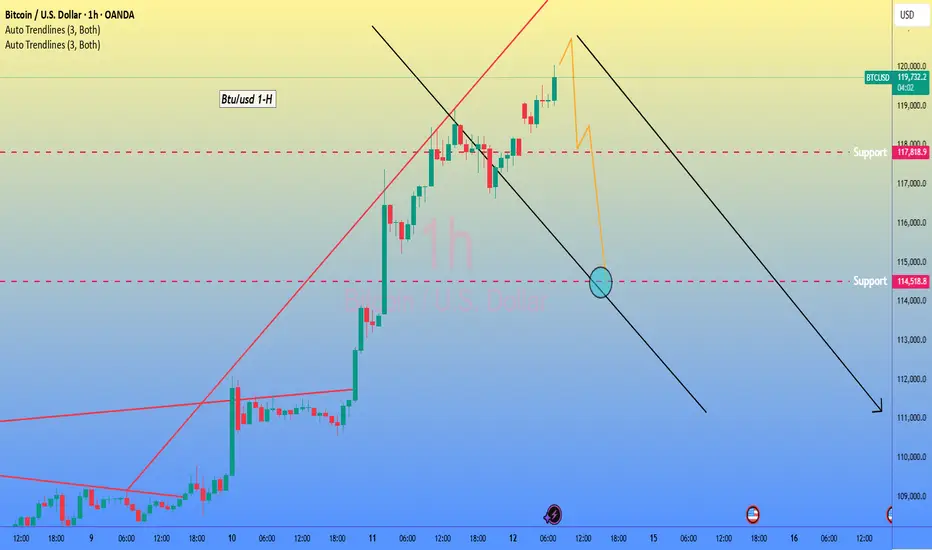
BTC/USD 1-hour chart, identifying a potential sell setup after a sharp rise.
A possible rising wedge or bearish channel breakout.
Price reacting at a resistance zone (~119,900–120,000).
A forecasted downward channel with target zones marked.
Sell Setup:
Entry Zone (Sell Area): 119,900 – 120,000
Stop Loss: Above 120,900 (above recent swing high)
Take Profit (TP) Targets:
1. TP1: 117,800 (first horizontal support)
2. TP2: 114,500 (second support and lower channel zone)
3. TP3: 111,300 (projected bottom of descending channel)
> Risk-Reward ratio looks favorable from this level if a reversal confirms with bearish candles or volume drop.
JOIN FREE SIGNALS TELEGRAM
t.me/forexsupppar1
FOREX MARKET ANALYSIS AND IDEAS
8 YEARS EXPERIENCE IN THIS FIELD
t.me/forexsupppar1
FOREX MARKET ANALYSIS AND IDEAS
8 YEARS EXPERIENCE IN THIS FIELD
免責聲明
這些資訊和出版物並不意味著也不構成TradingView提供或認可的金融、投資、交易或其他類型的意見或建議。請在使用條款閱讀更多資訊。
JOIN FREE SIGNALS TELEGRAM
t.me/forexsupppar1
FOREX MARKET ANALYSIS AND IDEAS
8 YEARS EXPERIENCE IN THIS FIELD
t.me/forexsupppar1
FOREX MARKET ANALYSIS AND IDEAS
8 YEARS EXPERIENCE IN THIS FIELD
免責聲明
這些資訊和出版物並不意味著也不構成TradingView提供或認可的金融、投資、交易或其他類型的意見或建議。請在使用條款閱讀更多資訊。