Chart Analysis
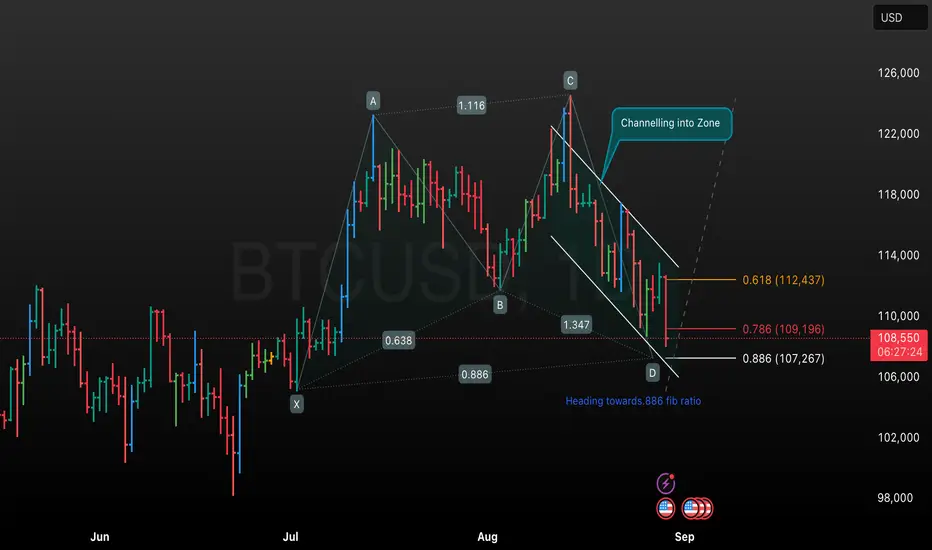
• The chart uses a harmonic pattern (possibly a Bat or Gartley pattern) marked by the points X, A, B, C, and D, with each leg labeled with its Fibonacci ratio (e.g., AB: 0.638, BC: 1.347, CD targeting 0.886).
• A trend channel is highlighted with the annotation “Channelling into Zone,” indicating price action is moving within a defined support and resistance path downwards.
• The two major Fibonacci retracement/support levels indicated are:
• 0.618 (112,437): This is a classic Fibonacci resistance zone where price may face strong selling pressure if it bounces.
• 0.786 (109,196): Another retracement level and a commonly watched zone for harmonic patterns.
• 0.886 (107,267): This is the final target for the D point in many harmonic patterns (such as a Bat), where a reversal is often anticipated.
• Price is currently at 108,429 USD, trading below both the 0.618 and 0.786 Fibonacci retracement levels, and approaching the 0.886 target, suggesting further downside is possible but a reversal could occur near the D point.
• The overall tone is slightly bearish until price reaches the projected D point (near 107,267), where traders might look for potential long setups if a reversal confirmation appears.
Key Observations
• Bearish channel: The trend is currently down, with price respecting the channel boundaries.
• Fibonacci confluence: Critical Fibonacci levels may offer support/resistance and act as potential reversal zones.
• Pattern completion: A harmonic pattern projects an oversold zone near the 0.886 ratio, often resulting in a corrective or reversal move.
• Watch for reversal confirmation: If price action shows support at or near the 0.886 Fibonacci zone, a bullish reversal is likely according to harmonic trading principles.
This analysis assumes familiarity with harmonic patterns, Fibonacci retracement, and candlestick channels as used in technical trading.
免責聲明
這些資訊和出版物並不意味著也不構成TradingView提供或認可的金融、投資、交易或其他類型的意見或建議。請在使用條款閱讀更多資訊。
免責聲明
這些資訊和出版物並不意味著也不構成TradingView提供或認可的金融、投資、交易或其他類型的意見或建議。請在使用條款閱讀更多資訊。