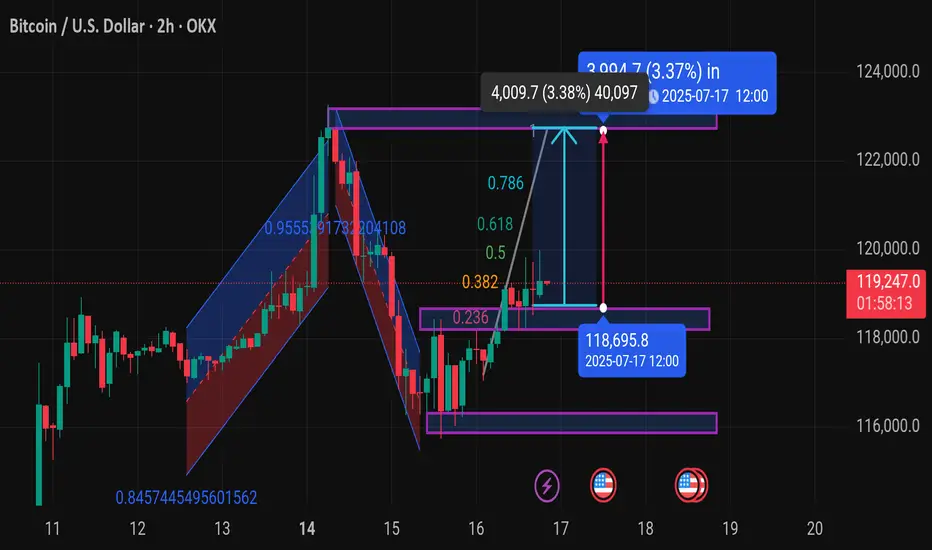
Chart Overview (BTC/USD - 2H, OKX):
Current Price: $119,240.5 (+1.23%)
Key Zones:
Support Zone: Around $118,695.8 (highlighted for July 17, 12:00)
Resistance/Target Zone: Around $123,250 (based on the measured move)
Fibonacci Levels: Drawn from the recent swing high to swing low
Important retracement levels: 0.236, 0.382, 0.5, 0.618, 0.786
Price is currently testing the 0.5–0.618 zone, which is a common area for potential breakout or rejection
Potential Price Move:
Bullish Projection:
Upside target of $4,009.7 (3.38%) from the breakout area
Reaching the $123,250 range by July 17 at 12:00 (UTC)
Technical Patterns:
It looks like you're tracking:
A potential bullish breakout from a consolidation range
Possibly a bullish flag or continuation pattern
Momentum is shifting after a clean bounce off the 0.236 zone
---
Let me know if you want:
A deeper analysis (e.g., RSI, MACD, volume)
Confirmation for long/short entries
Risk management suggestions
What’s your goal here — are you planning to trade this move or just analyzing the pattern?
🎯XAUUSD GOLD Daily 8-9 Free Signals🚀 World Best community Join Here ✅
💫XAUUSD
💫BTC
💫EURUSD
For Signals Telegram channel
⬇️⬇️⬇️⬇️⬇️⬇️⬇️⬇️⬇️⬇️⬇️⬇️⬇️
t.me/technicaltrader10
💫XAUUSD
💫BTC
💫EURUSD
For Signals Telegram channel
⬇️⬇️⬇️⬇️⬇️⬇️⬇️⬇️⬇️⬇️⬇️⬇️⬇️
t.me/technicaltrader10
免責聲明
這些資訊和出版物並不意味著也不構成TradingView提供或認可的金融、投資、交易或其他類型的意見或建議。請在使用條款閱讀更多資訊。