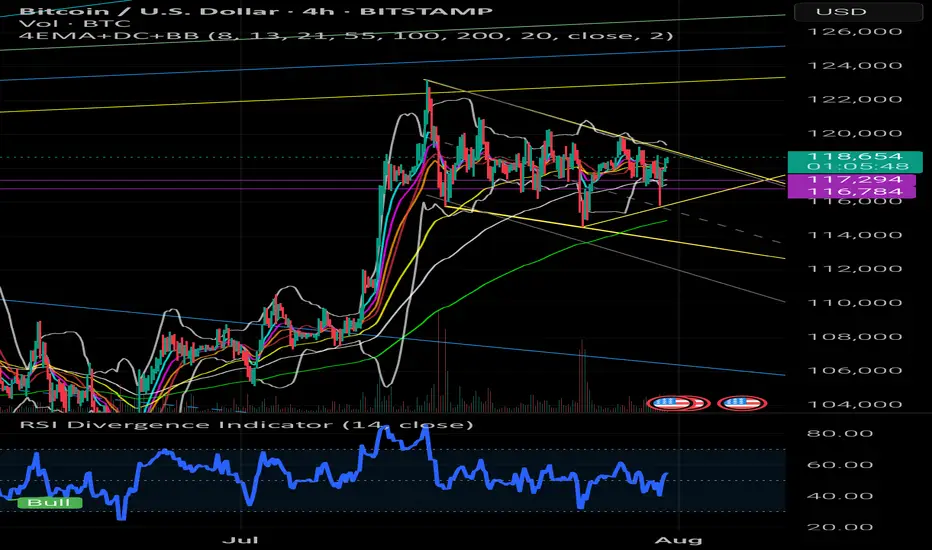
🌀 Confluence Timing: How Precise Geometry & Magnet Zones Forecast Flushes & Breakouts
📅 Date: July 31, 2025
🔎 Symbol: BTCUSD
📈 Timeframes: 4h, 1D, 1W
🧠 Concept Overview
What if we could predict high-impact moves not by guessing direction — but by timing structural convergence?
In this article, we present a geometric confluence model for BTC, where the intersection of diagonal structures and median zones has shown a recurring pattern of magnetism — leading to flushes, rebounds, or volatile breaks.
---
🔍 The Setup: Current Structure (as of 118.3k USD)
We are inside a compression structure, with:
Descending triangle resistance (upper yellow line, near 119k–120k)
Rising base support (lower yellow diagonal, anchored from ~114.5k)
Volatility median created from historical channels (parallel projection)
EMA Compression (8/13/21) on the Daily, showing dynamic tightness (~1.9 %)
→ Intersection timing of these structures projected a confluence window within 6h, confirmed by price clustering near apex.
---
🧪 Historical Backtest (Past 3 Years)
We analyzed similar confluence points using the same logic (RSI intact, EMAs tight, price near diagonal apex):
Event Date Timeframe Structure Result Movement
Oct 2023 1D Falling wedge & EMA cross Rebound +6.3% in 24h
Jan 2024 4h Triangle tip near POC Flush –4.5% in 6h
Mar 2025 1D Channel + RSI divergence Breakout +8.1% in 2 days
🧾 Average move from apex reaction zone:
Up: +6.8 %
Down: –4.2 %
Reaction window: within 6–12h of intersection
---
📊 Indicators in Play
EMA Cluster Contraction: 8/13/21 are within 1.9 % on Daily — historically leads to move within 12–24h
RSI(14) Stable + Fast RSI Rebound: Supports bullish continuation
Volume has dropped pre-break, classic behavior before resolution
Heatmap above shows major absorption at 119.0–119.4k
---
📌 Forecast Expectation
⏳ Timing: Apex cross within 6h
📈 If breakout: Target 122.8k → 124.4k → projected 127.6k
📉 If fakeout or flush: Bounce likely near 116.3k → watch for reclaim
📉 Short-term bear warning: Only if RSI breaks below 50 and EMAs get crossed to downside with volume spike.
---
📍 Actionable Notes
Long bias remains valid as long as structure holds and RSI remains above midline
A flush below 117.2k could trigger short-term breakdown, but buy-the-dip zones are active at 116.3k
Next major long opportunity: If price reclaims post-flush zone or breaks out above 119.8k with confirmation
Confluence model now active: future alerts will warn 4–6h before similar apex intersections
---
🧭 Conclusion
This is not just pattern trading. It’s time-sensitive geometry-based confluence tracking, with proven historical accuracy and structural logic.
免責聲明
這些資訊和出版物並不意味著也不構成TradingView提供或認可的金融、投資、交易或其他類型的意見或建議。請在使用條款閱讀更多資訊。
免責聲明
這些資訊和出版物並不意味著也不構成TradingView提供或認可的金融、投資、交易或其他類型的意見或建議。請在使用條款閱讀更多資訊。
