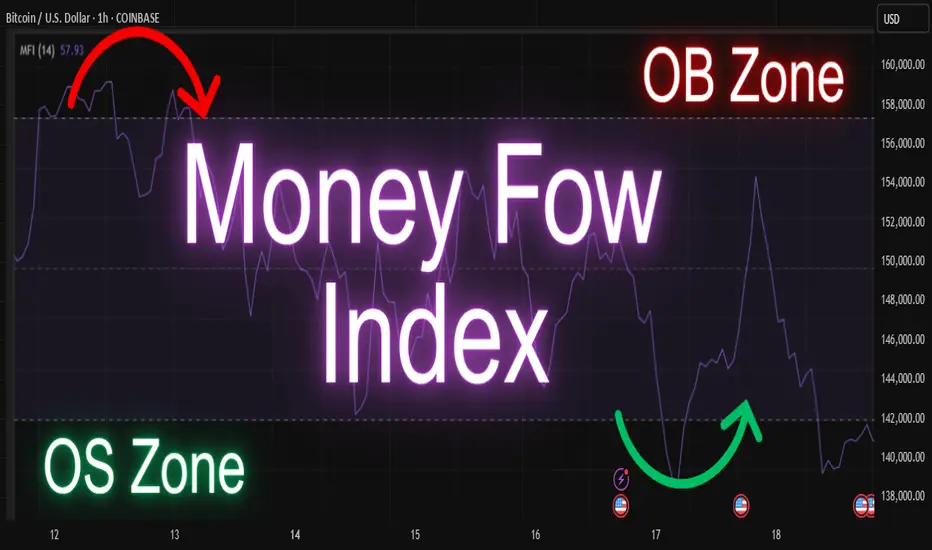
the money flow index (mfi) is a momentum indicator that uses both price and volume to measure buying and selling pressure
🧠 unlike rsi, which only considers price, mfi gives deeper insights by combining volume into the calculation
mfi values range from 0 to 100
1)above 80 = overbought zone

2)below 20 = oversold zone

🔍 traders use mfi to spot potential reversals, divergences, and to confirm trends
🛠️ you can combine mfi with other indicators like moving averages or support/resistance for better decision-making
🧪 test it on different timeframes to understand how it behaves with your strategy
Disclaimer :
This idea post is not financial advice, it's for educational purposes only, I am not a SEBI-registered advisor. Trading and investing involve risk, and you should consult with a qualified financial advisor before making any trading decisions. I do not guarantee profits or take responsibility for any losses you may incur.
🧠 unlike rsi, which only considers price, mfi gives deeper insights by combining volume into the calculation
mfi values range from 0 to 100
1)above 80 = overbought zone
2)below 20 = oversold zone
🔍 traders use mfi to spot potential reversals, divergences, and to confirm trends
🛠️ you can combine mfi with other indicators like moving averages or support/resistance for better decision-making
🧪 test it on different timeframes to understand how it behaves with your strategy
Disclaimer :
This idea post is not financial advice, it's for educational purposes only, I am not a SEBI-registered advisor. Trading and investing involve risk, and you should consult with a qualified financial advisor before making any trading decisions. I do not guarantee profits or take responsibility for any losses you may incur.
Shivam mandai
免責聲明
這些資訊和出版物並非旨在提供,也不構成TradingView提供或認可的任何形式的財務、投資、交易或其他類型的建議或推薦。請閱讀使用條款以了解更多資訊。
Shivam mandai
免責聲明
這些資訊和出版物並非旨在提供,也不構成TradingView提供或認可的任何形式的財務、投資、交易或其他類型的建議或推薦。請閱讀使用條款以了解更多資訊。