⊣
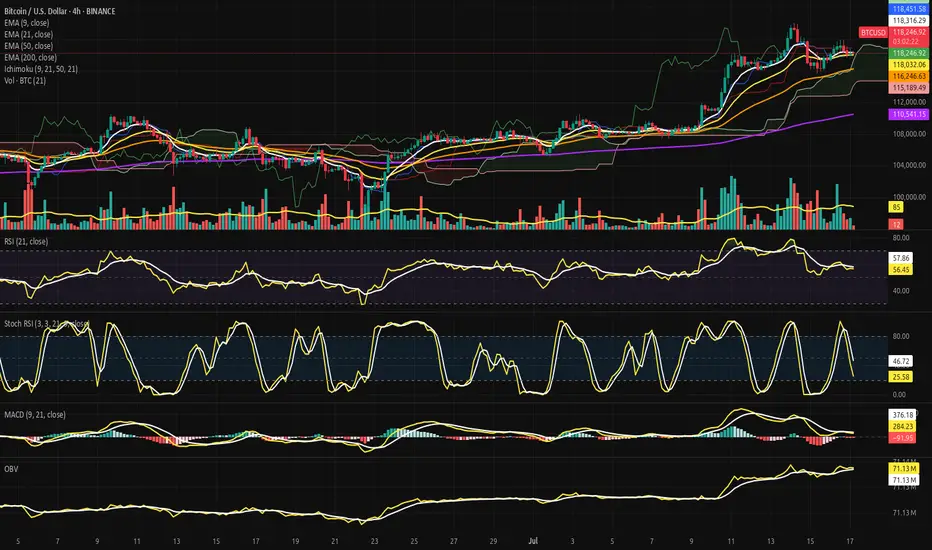
⟁ BTC/USD - BINANCE - (CHART: 4H) - (July 17, 2025).
◇ Analysis Price: $118,099.62.
⊣
⨀ I. Temporal Axis - Strategic Interval – (4H):
▦ EMA9 - (Exponential Moving Average - 9 Close):
∴ EMA9 is currently positioned at $118,286.83, marginally above the current price of $118,099.62;
∴ The slope of the EMA9 has begun to turn sideways-to-downward, indicating loss of short-term acceleration;
∴ The price has crossed below EMA9 within the last two candles, suggesting an incipient rejection of immediate bullish continuation.
✴️ Conclusion: Short-term momentum has weakened, positioning EMA 9 as immediate dynamic resistance.
⊢
▦ EMA21 - (Exponential Moving Average - 21 Close):
∴ EMA21 is measured at $118,018.67, positioned slightly below both price and EMA9, indicating a recent tightening of trend structure;
∴ The slope of EMA21 remains positive, preserving the medium-range bullish structure intact;
∴ EMA21 has been tested multiple times and held as support since July 15 - confirming tactical reliability as dynamic floor.
✴️ Conclusion: EMA21 stands as a critical pivot zone; any sustained breach would denote structural stress.
⊢
▦ EMA50 - (Exponential Moving Average - 50 Close):
∴ EMA50 is currently located at $116,240.85, well below current price action;
∴ The curve maintains a healthy positive inclination, affirming preservation of broader intermediate trend;
∴ No contact or proximity to EMA50 over the last 20 candles - indicating strong bullish detachment and buffer zone integrity.
✴️ Conclusion: EMA50 confirms medium-term bullish alignment; not yet challenged.
⊢
▦ EMA200 - (Exponential Moving Average - 200 Close):
∴ EMA200 stands at $110,539.69, forming the base of the entire 4H structure;
∴ The gradient is gradually rising, reflecting accumulation over a long time horizon;
∴ The distance between price and EMA200 reflects extended bullish positioning, yet also opens risk for sharp reversion if acceleration collapses.
✴️ Conclusion: Long-term structure remains bullish; early signs of overextension exist.
⊢
▦ Ichimoku Cloud - (9, 21, 50, 21):
∴ Price is currently above the Kumo (cloud), placing the pair within a bullish regime;
∴ Tenkan-sen (conversion) and Kijun-sen (base) lines show narrowing separation, suggesting momentum compression;
∴ Senkou Span A > Span B, and the cloud ahead is bullishly twisted, though thinning - indicating potential vulnerability despite structural advantage.
✴️ Conclusion: Bullish regime intact, but loss of momentum and cloud compression warrant caution.
⊢
▦ Volume + EMA21:
∴ Current volume for the latest candle is 3 BTC, compared to the EMA21 of 84 BTC;
∴ This indicates an extremely low participation phase, often associated with distribution zones or indecisive consolidation;
∴ Previous impulsive candles (July 15) reached well above 100 BTC - the current contraction is stark and strategically significant.
✴️ Conclusion: Absence of volume threatens trend continuation; energy depletion apparent.
⊢
▦ RSI - (21) + EMA9:
∴ RSI (21) is positioned at 55.73, marginally above neutral zone;
∴ EMA 9 of RSI is 57.71, crossing downward against RSI - bearish micro signal;
∴ No divergence is present versus price action - oscillator confirms current stagnation rather than exhaustion.
✴️ Conclusion: RSI losing strength above neutral; lacks momentum for breakout, but no capitulation.
⊢
▦ Stoch RSI - (3,3,21,9):
∴ %K is 21.44, %D is 45.34 - both pointing downward, in deacceleration phase;
∴ Recent rejection from overbought zone without full reset into oversold - signaling weak bullish thrust;
∴ Historical cycles show rhythmical reversals near current levels, but only with supportive volume, which is absent now.
✴️ Conclusion: Short-term momentum failed to sustain overbought breakout - micro-correction expected.
⊢
▦ MACD - (9, 21):
∴ MACD line is at -104.80, Signal line at 268.16 - large separation, histogram deeply negative;
∴ The bearish crossover occurred with declining volume, implying fading momentum rather than aggressive sell-off;
∴ No bullish divergence formed yet - continuation of correction remains technically favored.
✴️ Conclusion: MACD confirms trend exhaustion; no reversal in sight.
⊢
▦ OBV + EMA 9:
∴ OBV is 71.13M, perfectly aligned with its EMA9 - indicating equilibrium in volume flow;
∴ No directional bias in accumulation or distribution - flatlining suggests passive environment;
∴ Prior OBV uptrend has stalled since July 15 - reinforcing narrative of hesitation.
✴️ Conclusion: Institutional flow is neutral; no aggressive positioning detected.
⊢
🜎 Strategic Insight - Technical Oracle: The current price structure presents a classic post-impulse compression configuration within a preserved bullish environment. Despite the higher timeframe alignment, multiple short-term indicators exhibit tactical dissonance and signs of momentum decay. This inconsistency reflects a market caught between structural optimism and tactical hesitation.
♘ Key strategic signals - Structural Alignment:
∴ All major EMA's (9, 21, 50, 200) remain stacked in bullish order with no bearish crossovers imminent;
∴ Price remains above the Ichimoku Cloud and above EMA50 - both confirming structural dominance by buyers.
♘ Momentum Degradation:
∴ RSI (21) is drifting below its EMA9, weakening the momentum required for further upside continuation;
∴ Stochastic RSI has rolled over aggressively, failing to reach oversold before reversing - mid-cycle weakness is confirmed.
♘Volume Collapse:
∴ The current volume profile is critically weak - 3 Bitcoin against an average of 84 Bitcoins (EMA21);
∴ Price attempting to sustain above EMA's with no conviction signals distribution or passivity.
♘ MACD & OBV:
∴ MACD histogram remains deep in negative territory, and no bullish crossover is visible;
∴ OBV is flat - neither accumulation nor distribution dominates, leaving directional thrust suspended.
✴️ Oracle Insight:
∴ The technical field is Structurally Bullish, but Tactically Compressed.
∴ No breakout should be expected unless volume decisively returns above baseline (84 Bitcoins EMA);
∴ Below $117,800, the structure risks transition into a corrective phase;
∴ Above $118,450, potential trigger zone for bullish extension if accompanied by volume surge.
♘ Strategic posture:
∴ Wait-and-observe regime activated;
∴ No entry condition satisfies both structure and momentum at present;
∴ Tactical neutrality is advised until confirmation.
⊢
∫ II. On-Chain Intelligence - (Source: CryptoQuant):
▦ Exchange Reserve - (All Exchanges):
∴ The total Bitcoin reserves held on all exchanges continue a sharp and uninterrupted decline, now at ~2.4M BTC, down from over 3.4M in mid-2022;
∴ This downtrend has accelerated particularly after January 2025, with a visible drop into new lows - no accumulation rebound observed;
∴ Historically, every prolonged depletion of exchange reserves correlates with structural bullish setups, as supply becomes increasingly illiquid.
✴️ Conclusion: On-chain supply is structurally diminishing, confirming long-term bullish regime intact - mirrors technical EMA alignment.
⊢
▦ Fund Flow Ratio - (All Exchanges):
∴ Current Fund Flow Ratio stands at 0.114, which is well below historical danger thresholds seen near 0.20-0.25 during local tops;
∴ The ratio has remained consistently low throughout the 2025 uptrend, indicating that on-chain activity is not directed toward exchange-based selling;
∴ Spikes in this indicator tend to precede local corrections - but no such spike is currently present, reinforcing the notion of non-threatening capital flow.
✴️ Conclusion: Capital is not rotating into exchanges for liquidation - volume weakness seen in 4H chart is not linked to sell intent.
⊢
▦ Miners' Position Index - (MPI):
∴ The MPI sits firmly below the red threshold of 2.0, and currently ranges in sub-neutral levels (~0.5 and below);
∴ This suggests that miners are not engaging in aggressive distribution, and are likely retaining Bitcoin off-exchange;
∴ Sustained low MPI readings during price advances confirm alignment with institutional and long-term accumulation behavior.
✴️ Conclusion: Miner behavior supports structural strength - no mining-induced supply pressure present at this stage.
⊢
🜎 Strategic Insight - On-Chain Oracle:
∴ Across the three strategic indicators, no on-chain evidence supports short-term weakness;
∴ Supply is declining - (Exchange Reserve ↓);
∴ Funds are not preparing for exit - (Flow Ratio stable);
∴ Miners are not selling - (MPI subdued).
✴️ This constellation reinforces the thesis of Structural Bullishness with Tactical Compression, and suggests that any pullback is not backed by foundational stress.
⊢
𓂀 Stoic-Structural Interpretation:
∴ The multi-timeframe EMA stack remains intact and aligned - (9 > 21 > 50 > 200);
∴ Price floats above Ichimoku Cloud, and above EMA21 support, confirming elevated positioning within a macro bull channel;
∴ On-chain metrics confirm supply contraction, miner retention, and absence of fund rotation toward exchanges - structure remains sovereign;
∴ RSI - (21) slips under its EMA9 with low amplitude, indicating absence of energetic flow;
∴ Stoch RSI fails to reset fully and points downward - suggesting premature momentum decay;
∴ MACD histogram remains negative, while volume is significantly beneath EMA baseline (3 BTC vs 84 BTC);
∴ Price faces resistance at Kijun-sen ($118.451), acting as tactical ceiling; no breakout signal detected.
⊢
✴️ Interpretatio Finalis:
∴ Structural integrity remains unshaken - the architecture is bullish;
∴ Tactically, however, the battlefield is fogged - silence reigns in volume, hesitation in oscillators;
∴ A true continuation requires volume resurrection and resolution above $118,450. Until then, neutrality governs the edge.
⊢
⧉
Cryptorvm Dominvs · ⚜️ MAGISTER ARCANVM ⚜️ · Vox Primordialis
⌬ - Wisdom begins in silence. Precision unfolds in strategy - ⌬
⧉
⊢
註釋
⊢🔴 ARCANVM SIGNAL CONFIRMED - Tactical Inflow Spike Detected - (July 17, 2025).
▦ Exchange Inflow Total - (All Exchanges):
∴ Detected inflow: 47,782 BTC, sharply surpassing the tactical threshold of +5,000 BTC;
∴ This value exceeds the structural EMA-30 baseline (~3,200 BTC) by more than +1,400%, confirming a major anomaly;
∴ Such inflows are historically correlated with liquidity reallocation, distribution setups, or early phases of sell-side strategy - particularly when volume on charts is otherwise silent.
✴️ Conclusion: Structural On-Chain Spike Detected - The equilibrium has been breached, requires heightened monitoring for short-term volatility or liquidity extraction.
⊢
✴️ Recommendation: No directional move is implied yet, but this overrules the tactical neutrality from earlier if sustained. Should this inflow consolidate on-chain or on order books, the Cloud Gate compression may shift into Sell-Side Liquidity Event.
⊢
✠
Ritvs Logicæ in Terræ Chaos;
Nihil Tumultvs. Nihil Vanitatis. Tantum Silentivm, Structvra et Exsecutio.
𓂀 Vbi Volatilitas Disciplinam Tangit - Ibi Sto.
⩘ Porta Solum Aperitur Stantibvs in Silentio.
✠
Ritvs Logicæ in Terræ Chaos;
Nihil Tumultvs. Nihil Vanitatis. Tantum Silentivm, Structvra et Exsecutio.
𓂀 Vbi Volatilitas Disciplinam Tangit - Ibi Sto.
⩘ Porta Solum Aperitur Stantibvs in Silentio.
✠
相關出版品
免責聲明
這些資訊和出版物並不意味著也不構成TradingView提供或認可的金融、投資、交易或其他類型的意見或建議。請在使用條款閱讀更多資訊。
✠
Ritvs Logicæ in Terræ Chaos;
Nihil Tumultvs. Nihil Vanitatis. Tantum Silentivm, Structvra et Exsecutio.
𓂀 Vbi Volatilitas Disciplinam Tangit - Ibi Sto.
⩘ Porta Solum Aperitur Stantibvs in Silentio.
✠
Ritvs Logicæ in Terræ Chaos;
Nihil Tumultvs. Nihil Vanitatis. Tantum Silentivm, Structvra et Exsecutio.
𓂀 Vbi Volatilitas Disciplinam Tangit - Ibi Sto.
⩘ Porta Solum Aperitur Stantibvs in Silentio.
✠
相關出版品
免責聲明
這些資訊和出版物並不意味著也不構成TradingView提供或認可的金融、投資、交易或其他類型的意見或建議。請在使用條款閱讀更多資訊。