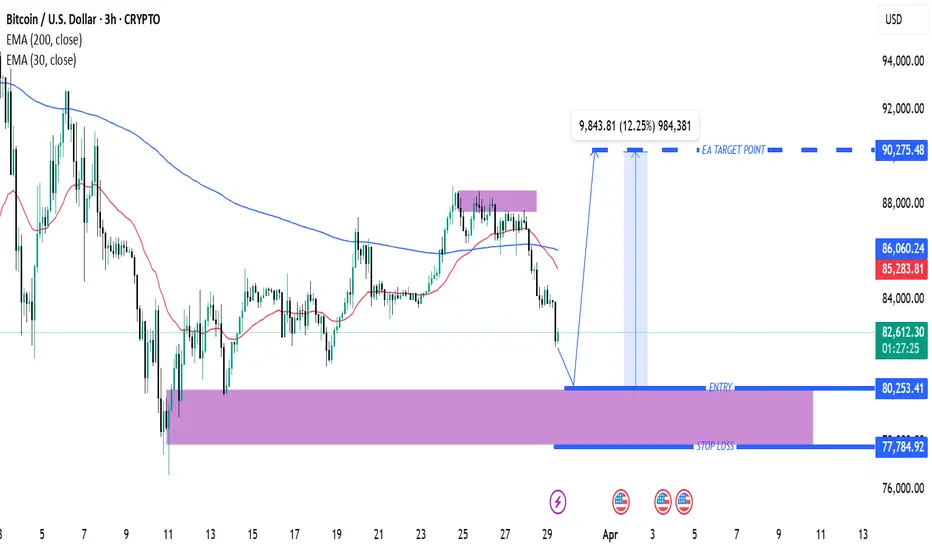
Support and Entry Zone (Purple Area at ~$80,253.41)
A significant support zone is marked in purple, indicating a potential area for entry.
This is an area where buying interest is expected.
Stop Loss (~$77,784.92)
A stop loss level is defined below the support zone, which is a risk management strategy.
Target Price (~$90,275.48)
The chart suggests a bullish move if the price bounces from the support.
The expected price increase is around 12.25% from the entry level.
Exponential Moving Averages (EMA)
30 EMA (Red Line, $85,290.12): Short-term trend indicator.
200 EMA (Blue Line, $86,061.21): Long-term trend indicator.
The price is currently below both EMAs, suggesting a bearish trend in the short term.
Market Outlook
The price has recently rejected resistance (purple zone above).
If it holds support at ~$80,253.41, a reversal to the upside is expected.
If the support breaks, further downside could follow.
Join my telegram (COPY_TRADE)
t.me/TOP1INVEESTADMEN
Join my refrel broker link
one.exnesstrack.org/a/l1t1rf3p6v
t.me/TOP1INVEESTADMEN
Join my refrel broker link
one.exnesstrack.org/a/l1t1rf3p6v
相關出版品
免責聲明
這些資訊和出版物並不意味著也不構成TradingView提供或認可的金融、投資、交易或其他類型的意見或建議。請在使用條款閱讀更多資訊。
Join my telegram (COPY_TRADE)
t.me/TOP1INVEESTADMEN
Join my refrel broker link
one.exnesstrack.org/a/l1t1rf3p6v
t.me/TOP1INVEESTADMEN
Join my refrel broker link
one.exnesstrack.org/a/l1t1rf3p6v
相關出版品
免責聲明
這些資訊和出版物並不意味著也不構成TradingView提供或認可的金融、投資、交易或其他類型的意見或建議。請在使用條款閱讀更多資訊。