(DAILY INTERVAL CHART)
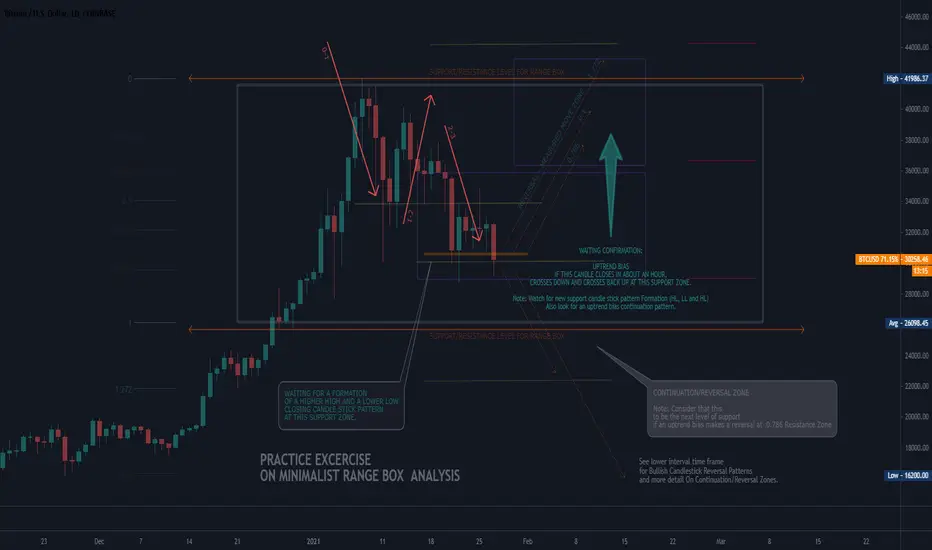
This is my practice exercise for my homework for a minimalist approach to chart analysis (No INDICATORS).
Using Range Boxes as Zones of interest, especially the tops and bottoms of it.
A Reversal (Double Bottom) is likely to happen if it forms new support candle stick pattern within the small box bottom in a couple of hours.
If not, look for a continuation pattern for a down trend bias towards the previous lowest support zone.
Note: This is not a financial advice. Your capital maybe at risk.
I am a beginner who is learning how to trade using paper trading to see the results of my daily analysis exercises.
註釋
HOURLY INTERVAL CHART交易進行
免責聲明
這些資訊和出版物並不意味著也不構成TradingView提供或認可的金融、投資、交易或其他類型的意見或建議。請在使用條款閱讀更多資訊。
免責聲明
這些資訊和出版物並不意味著也不構成TradingView提供或認可的金融、投資、交易或其他類型的意見或建議。請在使用條款閱讀更多資訊。