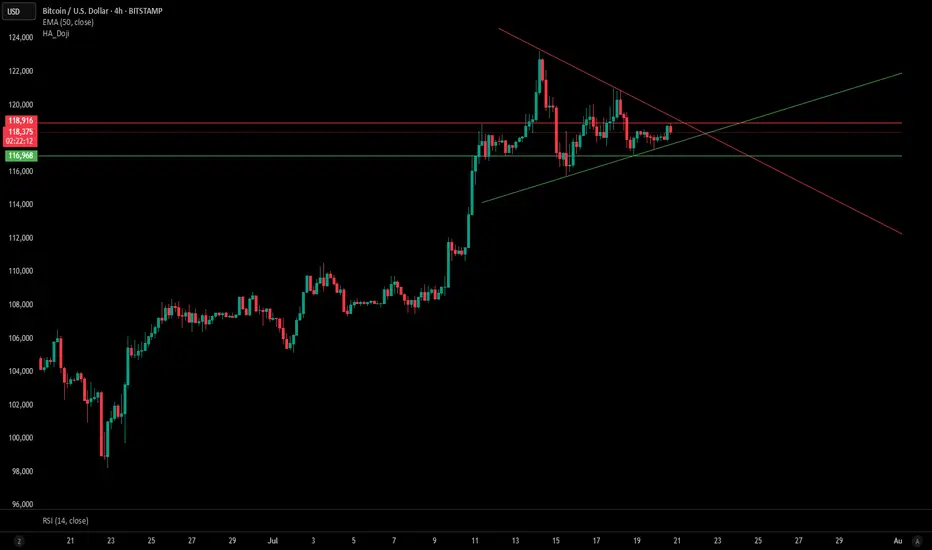
Bitcoin is currently consolidating within a symmetrical triangle pattern on the 4H chart, with both trendlines converging toward a decision point. Price is hovering just below the resistance line (~$118,900) and holding above key support at ~$116,968.
📊 Key Levels:
Resistance: $118,916 (triangle top / horizontal resistance)
Support: $116,968 (horizontal support)
EMA 50 (4H): $117,550 – currently acting as dynamic support
📉 RSI (14): Hovering near 50, indicating neutral momentum — awaiting confirmation of breakout direction.
A breakout above the descending trendline could trigger bullish momentum, while a break below the rising support may indicate further downside. Watch for volume confirmation on the breakout.
免責聲明
這些資訊和出版物並不意味著也不構成TradingView提供或認可的金融、投資、交易或其他類型的意見或建議。請在使用條款閱讀更多資訊。
免責聲明
這些資訊和出版物並不意味著也不構成TradingView提供或認可的金融、投資、交易或其他類型的意見或建議。請在使用條款閱讀更多資訊。