🔹 1. Historic Bear Market Drops Are Identical
Each cycle produced almost the same percentage crash from top to bottom:
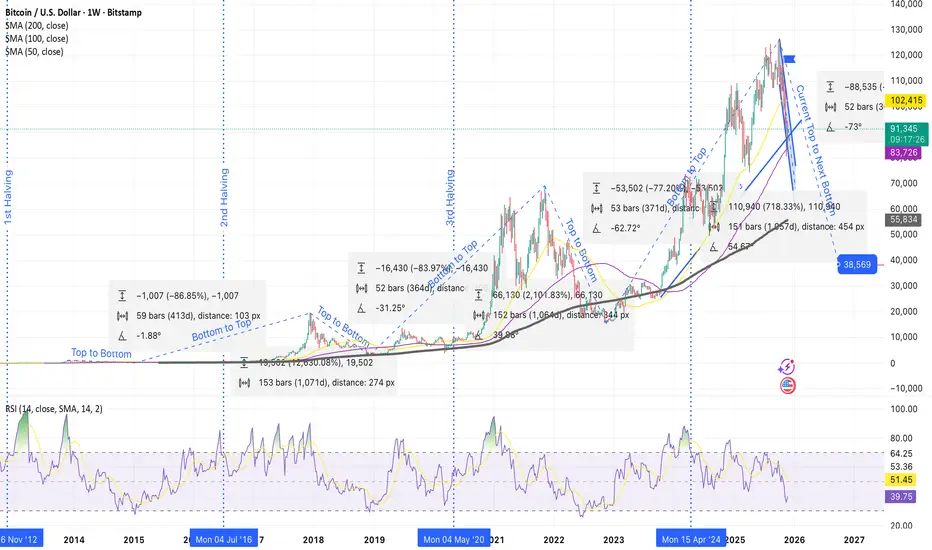
• Cycle 1: –86.85%
• Cycle 2: –83.97%
• Cycle 3: –77.20%
• Current Cycle (Projection): –70% to –75%
Every cycle becomes slightly less volatile, but the pattern is still the same:
The top is always followed by a huge correction.
⸻
🔹 2. The Cycle Durations Are Nearly Perfect Copies
Top → Bottom timing
• Cycle 1: 59 weeks
• Cycle 2: 52 weeks
• Cycle 3: 53 weeks
• Current projection: ~52 weeks
⏳ Every major Bitcoin top takes ~1 year to reach the bottom.
Bottom → Next Top timing
• Cycle 1: ~1070 days
• Cycle 2: ~1057 days
• Cycle 3: ~1057 days
• Current cycle follows the same length exactly.
⸻
🔹 3. Bitcoin Always Bottoms Near the 200-Week SMA
Every cycle bottom touches or slightly dips below the 200-week moving average (black line).
Your projection shows the same thing happening again:
📉 Projected BTC bottom: ~$38,000 – $40,000
Exactly where the 200-week SMA and long-term trendline converge.
⸻
🔹 4. Current Cycle Is Following the Previous One Perfectly
Your chart overlays show:
• The 2025 top mirrors the 2021 top
• The decline angle is almost identical
• RSI is falling the same way it did in every bear market start
• The projected drop of –70% from the 2025 top leads directly to the $38K bottom zone
This is the same structure as:
• 2013 → 2015
• 2017 → 2018
• 2021 → 2022
⸻
🔹 5. What’s Next?
If Bitcoin continues to follow its 4-year cycle:
📉 Bear Market Bottom: ~$38K in 2026
📈 Next Major Bull Run: 2026–2028
🏁 Major Cycle Top: around 2028–2029
⸻
🧠 “Bitcoin has never broken its 4-year cycle. Each top is followed by a –70% bear market, and each bottom leads into the next halving bull run.”
📜 Disclaimer: This is general information only and not financial advice.
Each cycle produced almost the same percentage crash from top to bottom:
• Cycle 1: –86.85%
• Cycle 2: –83.97%
• Cycle 3: –77.20%
• Current Cycle (Projection): –70% to –75%
Every cycle becomes slightly less volatile, but the pattern is still the same:
The top is always followed by a huge correction.
⸻
🔹 2. The Cycle Durations Are Nearly Perfect Copies
Top → Bottom timing
• Cycle 1: 59 weeks
• Cycle 2: 52 weeks
• Cycle 3: 53 weeks
• Current projection: ~52 weeks
⏳ Every major Bitcoin top takes ~1 year to reach the bottom.
Bottom → Next Top timing
• Cycle 1: ~1070 days
• Cycle 2: ~1057 days
• Cycle 3: ~1057 days
• Current cycle follows the same length exactly.
⸻
🔹 3. Bitcoin Always Bottoms Near the 200-Week SMA
Every cycle bottom touches or slightly dips below the 200-week moving average (black line).
Your projection shows the same thing happening again:
📉 Projected BTC bottom: ~$38,000 – $40,000
Exactly where the 200-week SMA and long-term trendline converge.
⸻
🔹 4. Current Cycle Is Following the Previous One Perfectly
Your chart overlays show:
• The 2025 top mirrors the 2021 top
• The decline angle is almost identical
• RSI is falling the same way it did in every bear market start
• The projected drop of –70% from the 2025 top leads directly to the $38K bottom zone
This is the same structure as:
• 2013 → 2015
• 2017 → 2018
• 2021 → 2022
⸻
🔹 5. What’s Next?
If Bitcoin continues to follow its 4-year cycle:
📉 Bear Market Bottom: ~$38K in 2026
📈 Next Major Bull Run: 2026–2028
🏁 Major Cycle Top: around 2028–2029
⸻
🧠 “Bitcoin has never broken its 4-year cycle. Each top is followed by a –70% bear market, and each bottom leads into the next halving bull run.”
📜 Disclaimer: This is general information only and not financial advice.
免責聲明
這些資訊和出版物並非旨在提供,也不構成TradingView提供或認可的任何形式的財務、投資、交易或其他類型的建議或推薦。請閱讀使用條款以了解更多資訊。
免責聲明
這些資訊和出版物並非旨在提供,也不構成TradingView提供或認可的任何形式的財務、投資、交易或其他類型的建議或推薦。請閱讀使用條款以了解更多資訊。