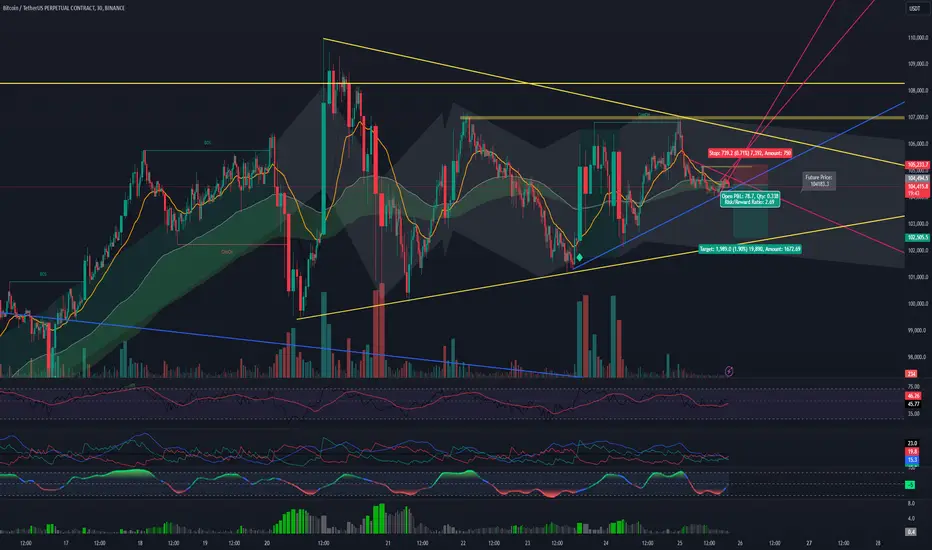
Resistance Rejection: Price rejected at a horizontal resistance zone, showing bearish pressure with wick formations indicating seller dominance.
Trendline Respect: Price respects a descending trendline, supporting bearish continuation probabilities.
EMA Confluence: Below the 50 EMA, signaling weakening bullish momentum.
Volume Decline: Reduced buying volume suggests fading demand, aligning with bearish sentiment.
Indicators Align Bearish:
RSI trending downward near midline.
MACD showing a potential bearish crossover.
Risk/Reward: Favorable 2.09 ratio, with clear invalidation above resistance and significant downside potential.
Cloud Base Test: A break below the Ichimoku Cloud base could accelerate bearish movement.
Probabilities:
Bearish Continuation: ~65%.
Bullish Recovery: ~35%.
Plan:
Entry: On a breakdown below horizontal support.
Stop Loss: Above resistance.
Target: Next support zone or lower trendline.
Multiple confirmations favor a short trade setup. Manage risk effectively.
A Haque
Founder | MyTradingJournal
📊 Financial Market Analyst | Trader | Educator
🐦 Twitter: @MyTradingJnl6th
📺 YouTube: @MyTradingJournal6th
Founder | MyTradingJournal
📊 Financial Market Analyst | Trader | Educator
🐦 Twitter: @MyTradingJnl6th
📺 YouTube: @MyTradingJournal6th
免責聲明
這些資訊和出版物並不意味著也不構成TradingView提供或認可的金融、投資、交易或其他類型的意見或建議。請在使用條款閱讀更多資訊。