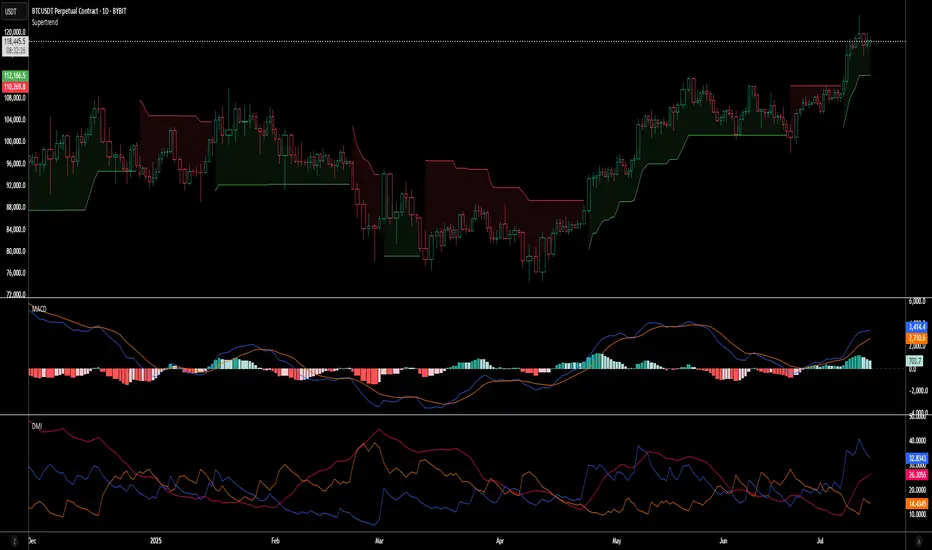
Many commonly used indicators—RSI, MACD, and others—show win rates around **30–40%** when used as direct trade signals and may make a slight profit overall, but loose in a ranging market.
Oddly enough, if you reverse them—buy when it says sell, sell when it says buy—you can often push the win rate up to **65–70%**.
But here’s the catch:
👉 Even with a high win rate, these “inverse strategies” still **tend to lose money** over time. Why? The few times the market trends it will wipe out any profits you might have made.
---
🧠 What's Really Going On?
* Indicators trigger **crowd behavior**, not institutional intent.
* Institutions use crowd-driven signals to identify **liquidity clusters**
* Standard signals become **traps**, not trade ideas.
I call this Hidden or Dynamic liquidity
So when indicators say "Buy!", the smart money sees that as an opportunity to sell *into* the crowd’s enthusiasm—then reverse the move once retail traders are trapped.
Institutions can see when, say the 20 SMA is about to cross the 50 SMA. This gives them a heads up that and opportunity may be coming to use the liquidity it generates from the ensuing retail trades to enter their opposing trades.
---
⚠️ Takeaway:
Indicators may be more useful as **tools to locate liquidity**, not predict direction.
Use them to observe where *others* are getting in, then ask:
🔍 *If I were a large player needing liquidity, where would I execute my order?*
See Indicators triggering not as entry positions but as potential pivot points.
免責聲明
這些資訊和出版物並不意味著也不構成TradingView提供或認可的金融、投資、交易或其他類型的意見或建議。請在使用條款閱讀更多資訊。
免責聲明
這些資訊和出版物並不意味著也不構成TradingView提供或認可的金融、投資、交易或其他類型的意見或建議。請在使用條款閱讀更多資訊。