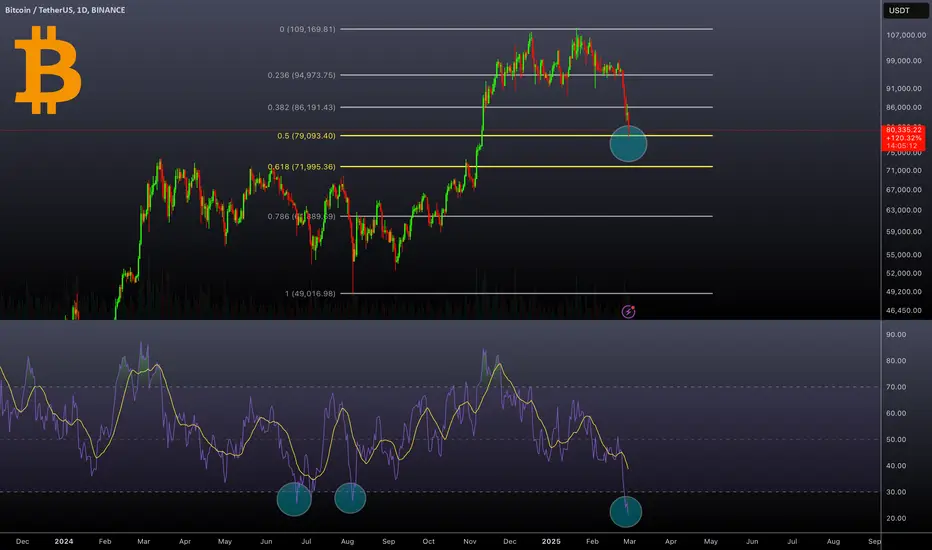
Bitcoin's daily chart shows a significant price retracement, currently testing the key 0.5 Fibonacci level around $79,000. This level historically acts as a strong support zone during corrective phases. If BTC holds above this level, it could signal a potential rebound. However, if it breaks lower, the next major support is near $72,000 (0.618 Fibonacci level).
Additionally, the Relative Strength Index (RSI) has dropped to the 20 level, indicating extreme oversold conditions. Historically, such low RSI readings have led to strong reversals. If buying pressure emerges, BTC could see a recovery from these levels.
Regards
Hexa
Additionally, the Relative Strength Index (RSI) has dropped to the 20 level, indicating extreme oversold conditions. Historically, such low RSI readings have led to strong reversals. If buying pressure emerges, BTC could see a recovery from these levels.
Regards
Hexa
🚀Telegram : t.me/hexatrades
🌐Website: hexatrades.io/
🗣️Twitter(X): twitter.com/HexaTrades
🌐Website: hexatrades.io/
🗣️Twitter(X): twitter.com/HexaTrades
相關出版品
免責聲明
這些資訊和出版物並不意味著也不構成TradingView提供或認可的金融、投資、交易或其他類型的意見或建議。請在使用條款閱讀更多資訊。
🚀Telegram : t.me/hexatrades
🌐Website: hexatrades.io/
🗣️Twitter(X): twitter.com/HexaTrades
🌐Website: hexatrades.io/
🗣️Twitter(X): twitter.com/HexaTrades
相關出版品
免責聲明
這些資訊和出版物並不意味著也不構成TradingView提供或認可的金融、投資、交易或其他類型的意見或建議。請在使用條款閱讀更多資訊。