Is Bitcoin about to break through by exploring the upper edge of triangle organization?

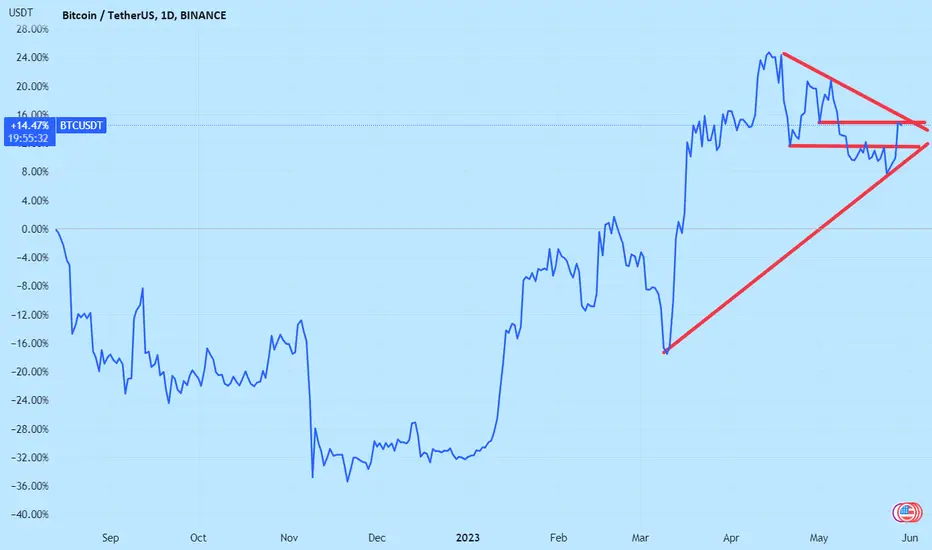
This figure shows the line chart of Bitcoin since September 2022. The graph overlays the lines between recent lows and lows, the lines between highs and highs, and the horizontal lines of recent bullish and bearish starting positions. As shown in the figure, Bitcoin has already faced strong pressure to break through the bearish starting point before the recent low point, opening up space! In the future, we need to focus on whether Bitcoin can break through the existing large triangle oscillation range in one go!
This figure shows the line chart of Bitcoin since September 2022. The graph overlays the lines between recent lows and lows, the lines between highs and highs, and the horizontal lines of recent bullish and bearish starting positions. As shown in the figure, Bitcoin has already faced strong pressure to break through the bearish starting point before the recent low point, opening up space! In the future, we need to focus on whether Bitcoin can break through the existing large triangle oscillation range in one go!
免責聲明
這些資訊和出版物並不意味著也不構成TradingView提供或認可的金融、投資、交易或其他類型的意見或建議。請在使用條款閱讀更多資訊。
免責聲明
這些資訊和出版物並不意味著也不構成TradingView提供或認可的金融、投資、交易或其他類型的意見或建議。請在使用條款閱讀更多資訊。