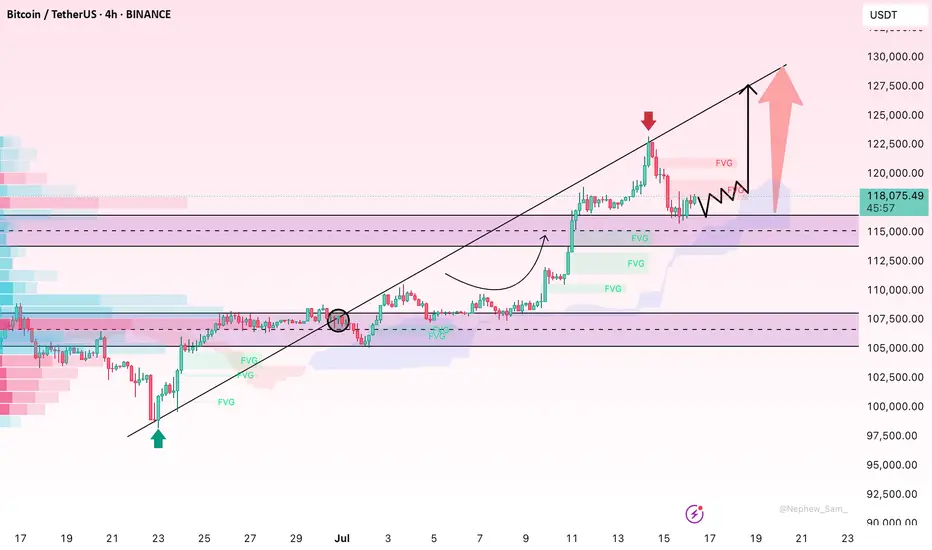
After a sharp rally past the $122,000 mark, Bitcoin is now undergoing what appears to be a textbook pullback — not a sign of weakness, but a calculated pause. On the H4 chart, BTC has retraced into the $115,000–$117,000 zone, aligning perfectly with a key Fair Value Gap (FVG) left unfilled during the breakout. This zone also overlaps the Ichimoku cloud, suggesting strong dynamic support. Volume has slightly tapered off during the decline, pointing more toward profit-taking rather than a structural breakdown.
Importantly, the bullish structure remains intact: higher highs and higher lows continue to dominate, previous FVGs are respected, and the main trend remains underpinned by institutional demand from the $110,000 base. A clean breakout above $122,800 could reignite momentum toward $126,500 or even $130,000 — areas where liquidity from prior distribution zones still lingers.
Importantly, the bullish structure remains intact: higher highs and higher lows continue to dominate, previous FVGs are respected, and the main trend remains underpinned by institutional demand from the $110,000 base. A clean breakout above $122,800 could reignite momentum toward $126,500 or even $130,000 — areas where liquidity from prior distribution zones still lingers.
交易進行
Trade like you mean it – because every second matters.
📊 Instant insights.
📬 Precision signals.
👨🏫 Real coaching. Real results.
👉🏻Join here: t.me/+jBAj1Jdf4vY1NzM1
📊 Instant insights.
📬 Precision signals.
👨🏫 Real coaching. Real results.
👉🏻Join here: t.me/+jBAj1Jdf4vY1NzM1
相關出版品
免責聲明
這些資訊和出版物並不意味著也不構成TradingView提供或認可的金融、投資、交易或其他類型的意見或建議。請在使用條款閱讀更多資訊。