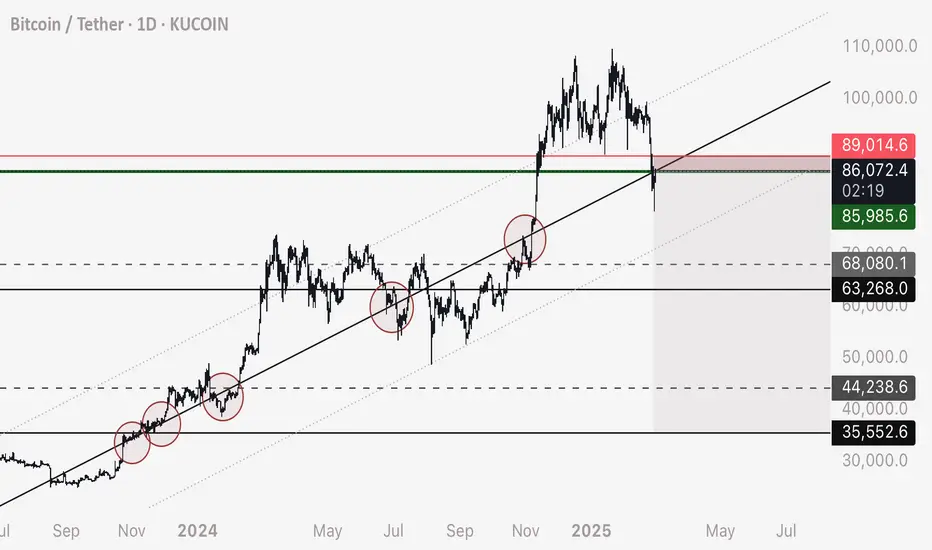
I’ve drawn the main trendline and marked the contact points in red circles if you’d like to replicate this on your own chart
I’ve also demonstrated that when the correct trendline is identified, it can be duplicated and placed at different points on the chart that price seems to follow - IE support / resistance works on a diagonal grid
I’ve marked my personal entry in green, stop loss in red - minor targets in grey dashed lines and major targets in black solid lines
Fundamentally this drop makes sense as there is a mass amount of liquidity in these below zones.
Not financial advice, do your own research and experimentations.
God speed!
免責聲明
這些資訊和出版物並不意味著也不構成TradingView提供或認可的金融、投資、交易或其他類型的意見或建議。請在使用條款閱讀更多資訊。