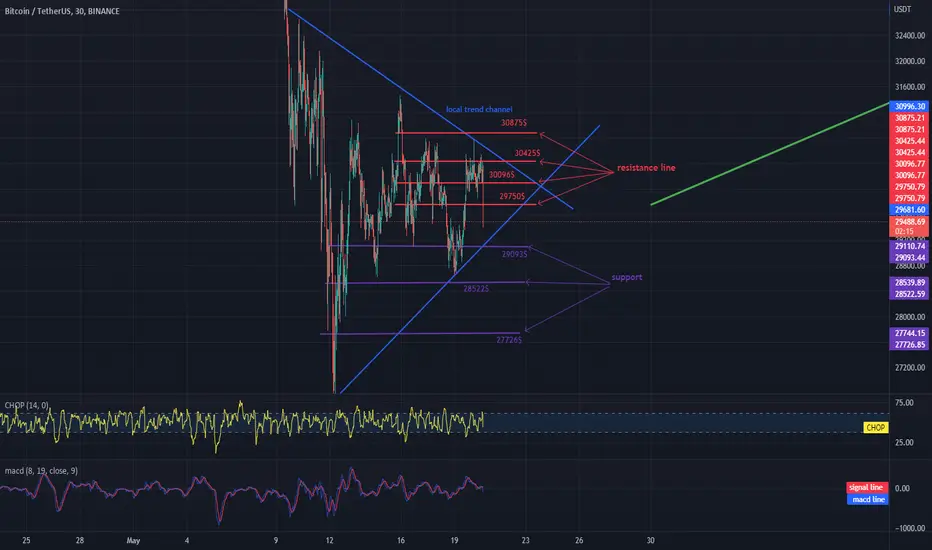
Hello everyone, let's take a look at the BTC to USDT chart on a 30-minute time frame. As you can see, the price moves in the triangle delineated by the blue lines.
Let's start with the designation of the support line and as you can see the first support in the near future is $ 29,093, if the support breaks down, the next one is $ 28,522 and $ 27,726.
Now let's move from the resistance line as you can see the first resistance is $ 29,750, if you can break it the next resistance will be $ 30,096 and $ 30,425 and $ 30,875.
Looking at the CHOP indicator, we can see that most of the energy has been used in the 30-minute interval.
免責聲明
這些資訊和出版物並不意味著也不構成TradingView提供或認可的金融、投資、交易或其他類型的意見或建議。請在使用條款閱讀更多資訊。
免責聲明
這些資訊和出版物並不意味著也不構成TradingView提供或認可的金融、投資、交易或其他類型的意見或建議。請在使用條款閱讀更多資訊。