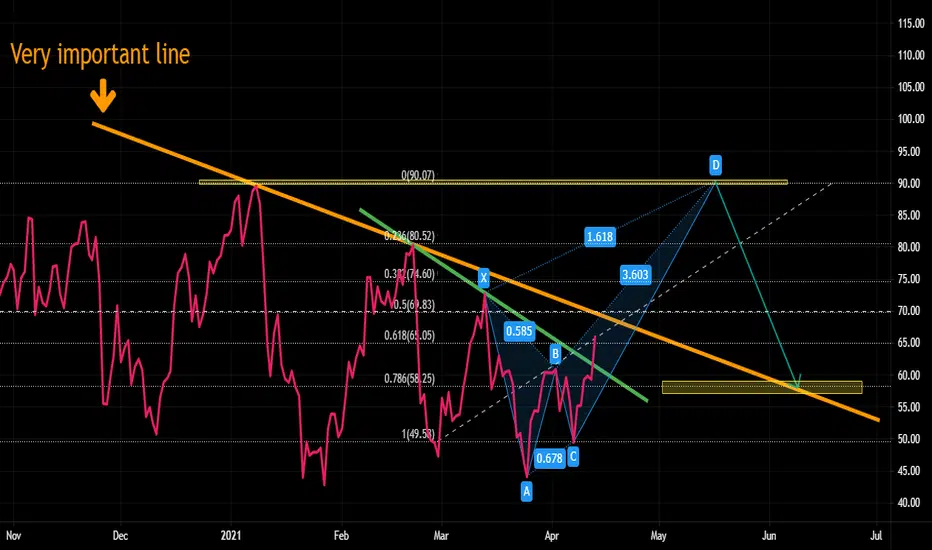
In the daily chart, an obvious divergence is visible. If Bitcoin breaks the important orange trend line (I emphasize the orange trend line is extremely important), it will break the daily divergence out and probably it will rise up in order to complete crab harmonic pattern (RSI level 90). And then, it might fall down to RSI level 58.
And yet, what will happen to Bitcoin price ?
I will illustrate that in my next post.
And yet, what will happen to Bitcoin price ?
I will illustrate that in my next post.
免責聲明
這些資訊和出版物並不意味著也不構成TradingView提供或認可的金融、投資、交易或其他類型的意見或建議。請在使用條款閱讀更多資訊。
免責聲明
這些資訊和出版物並不意味著也不構成TradingView提供或認可的金融、投資、交易或其他類型的意見或建議。請在使用條款閱讀更多資訊。