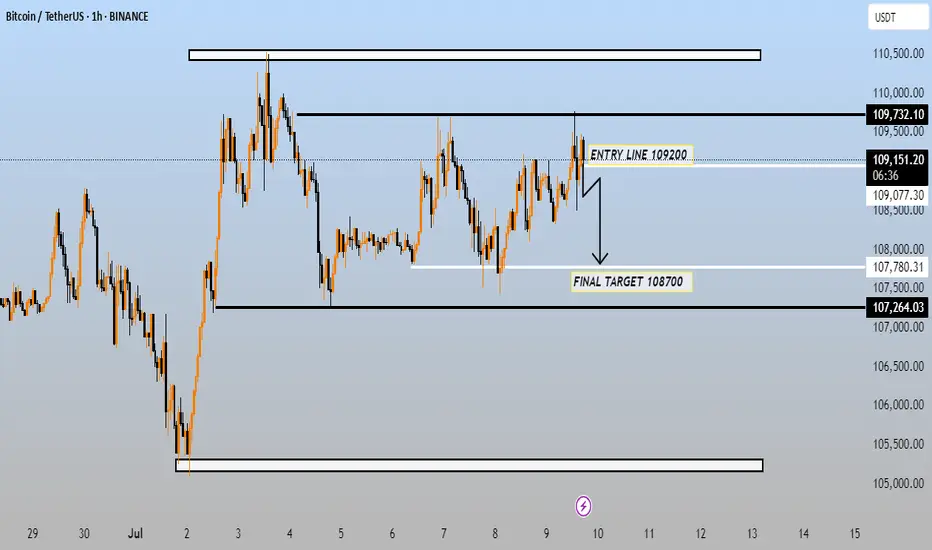
This chart is a Bitcoin (BTC/USDT) trading setup on the 1-hour timeframe. Here's a breakdown of the key elements:
🔍 Trade Setup Summary
Entry Line: 109200
Final Target: 108700
Current Price: 109118.14 (below the entry line)
Resistance Zone: Around 109732.10
Support Zone: Around 107264.03
📉 Strategy Interpretation
This appears to be a short trade setup:
Sell/Short Entry: At 109200
Target (Take Profit): 108700
This implies the trader expects BTC to drop from current levels toward the support area.
Stop-loss (not marked but implied): Likely just above 109732.10 (resistance zone)
⚠ Risk/Reward Outlook
Risk: Approximately 500–600 points (if SL is above resistance)
Reward: Around 500 points (from 109200 to 108700)
Risk-Reward Ratio: Close to 1:1, assuming a tight SL
---
Let me know if you want help calculating position size, refining this trade setup, or exploring a bullish alternative.
免責聲明
這些資訊和出版物並不意味著也不構成TradingView提供或認可的金融、投資、交易或其他類型的意見或建議。請在使用條款閱讀更多資訊。
免責聲明
這些資訊和出版物並不意味著也不構成TradingView提供或認可的金融、投資、交易或其他類型的意見或建議。請在使用條款閱讀更多資訊。