Highlights
Description
On the hourly timeframe, a sideways movement has been observed since November 9th. The upper boundary of the sideways range is at 37980. Judging by the wicks of yesterday's hourly candles (see chart), buyers are pushing the prices beyond the sideways range. Buying at the top of the range is not systematic. But if you really want to trade, you can aggressively look for buys when buyers defend the wicks of yesterday's hourly candles. (if the price returns there before breaking out of the sideways range).


- Waiting for the price to interact with the upper boundary of the sideways range at 37980.
- Preference (buying/selling) - neutral.
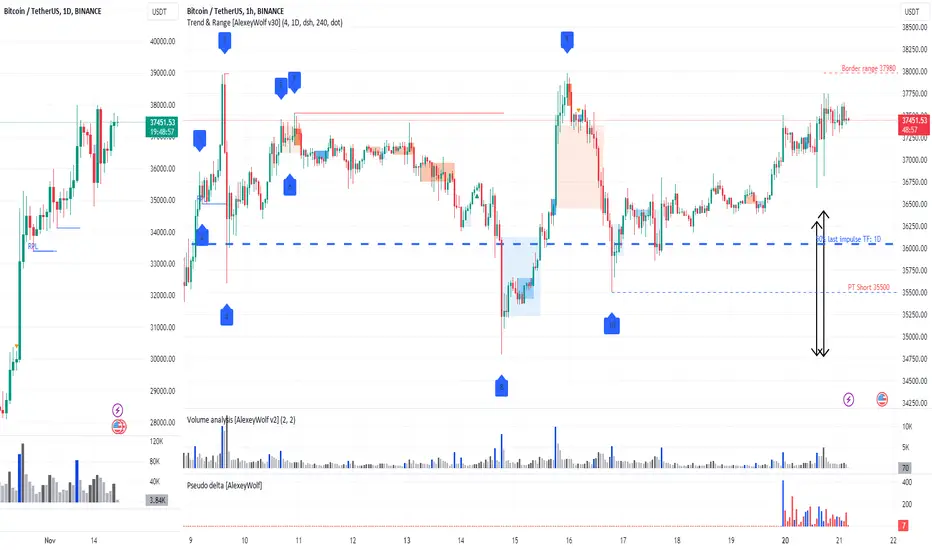
Description
On the hourly timeframe, a sideways movement has been observed since November 9th. The upper boundary of the sideways range is at 37980. Judging by the wicks of yesterday's hourly candles (see chart), buyers are pushing the prices beyond the sideways range. Buying at the top of the range is not systematic. But if you really want to trade, you can aggressively look for buys when buyers defend the wicks of yesterday's hourly candles. (if the price returns there before breaking out of the sideways range).
- 31812, 36677 - boundaries on the five-minute timeframe
- 37302 - boundary on the one-minute timeframe.
Wishing you profitable trades!
Clarity on the Chart. Smart Trading Decisions.
No signals. Just clean structure and context t.me/user_friendly_trading
Clarity on the Chart. Smart Trading Decisions.
No signals. Just clean structure and context t.me/user_friendly_trading
免責聲明
這些資訊和出版物並不意味著也不構成TradingView提供或認可的金融、投資、交易或其他類型的意見或建議。請在使用條款閱讀更多資訊。