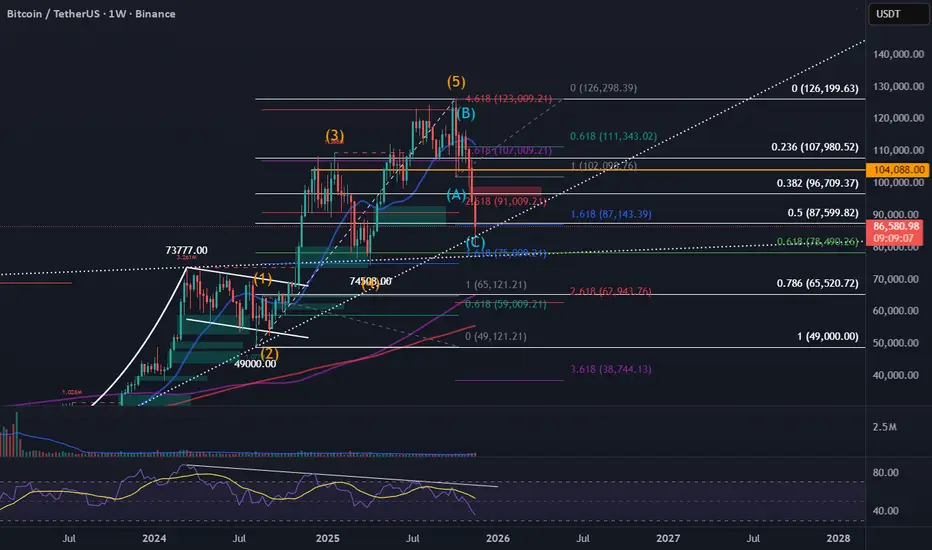
This chart provides a long-term Elliott Wave and Fibonacci confluence analysis for Bitcoin on the weekly timeframe.
After completing a full 5-wave impulsive structure, BTC appears to have entered a corrective ABC pattern, with Wave (C) extending sharply into major support levels. Current price action is testing a powerful cluster of Fibonacci retracements and extensions, including the 1.618, 0.618, and a long-term ascending trendline.
Expection: weekly candle closing above 87,143 and go upwards.
免責聲明
這些資訊和出版物並非旨在提供,也不構成TradingView提供或認可的任何形式的財務、投資、交易或其他類型的建議或推薦。請閱讀使用條款以了解更多資訊。
免責聲明
這些資訊和出版物並非旨在提供,也不構成TradingView提供或認可的任何形式的財務、投資、交易或其他類型的建議或推薦。請閱讀使用條款以了解更多資訊。