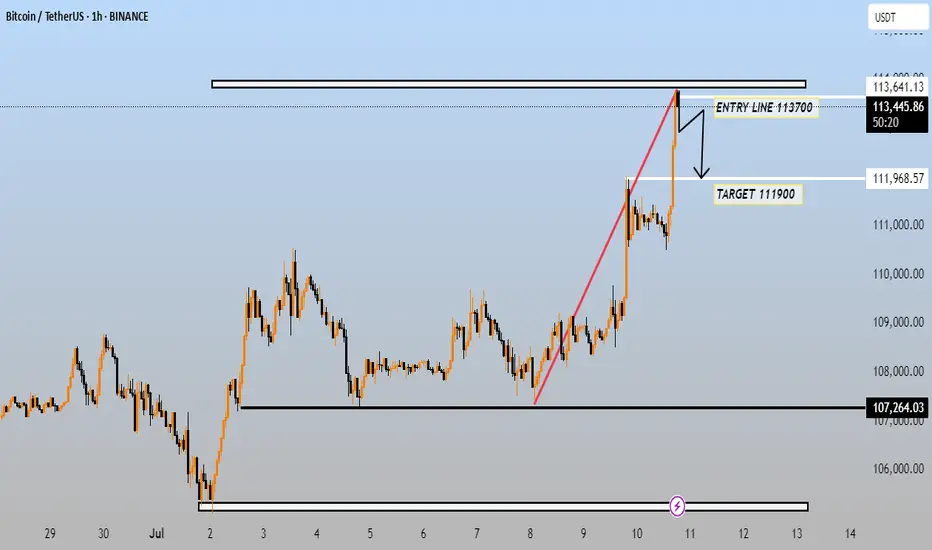
This chart is a Bitcoin (BTC) to Tether (USDT) trading setup on the 1-hour timeframe, published on July 10, 2025. Here’s a breakdown of the technical setup and what it suggests:
---
🔍 Key Levels & Strategy
Entry Line: 113,700 USDT
This is the suggested short (sell) entry point — indicating a potential price reversal or resistance zone near the recent high.
Target: 111,900 USDT
This is the take-profit target — implying a retracement expectation of around 1.6%.
Resistance Zone: Around 113,641.13 USDT
This is the recent local high where the price might face selling pressure.
Support Zone: 107,264.03 USDT
A much lower support area from earlier in July, likely the next major demand zone if the price drops significantly.
---
📉 Trade Idea Summary
Bias: Bearish (short position expected)
Rationale: After a strong upward move (marked by the red trend line), price hit resistance and is expected to correct downward.
Risk Management: The entry is near the high; a tight stop loss above 113,700 could be used to limit downside risk if the trade goes against the position.
---
⚠ Things to Watch
A confirmed rejection from the 113,700 level is important before shorting.
A breakout above 113,700 invalidates the short idea.
Look for bearish candlestick patterns (e.g., bearish engulfing or shooting star) for confirmation.
Would you like help setting up a stop loss or calculating the risk/reward ratio for this trade?
---
🔍 Key Levels & Strategy
Entry Line: 113,700 USDT
This is the suggested short (sell) entry point — indicating a potential price reversal or resistance zone near the recent high.
Target: 111,900 USDT
This is the take-profit target — implying a retracement expectation of around 1.6%.
Resistance Zone: Around 113,641.13 USDT
This is the recent local high where the price might face selling pressure.
Support Zone: 107,264.03 USDT
A much lower support area from earlier in July, likely the next major demand zone if the price drops significantly.
---
📉 Trade Idea Summary
Bias: Bearish (short position expected)
Rationale: After a strong upward move (marked by the red trend line), price hit resistance and is expected to correct downward.
Risk Management: The entry is near the high; a tight stop loss above 113,700 could be used to limit downside risk if the trade goes against the position.
---
⚠ Things to Watch
A confirmed rejection from the 113,700 level is important before shorting.
A breakout above 113,700 invalidates the short idea.
Look for bearish candlestick patterns (e.g., bearish engulfing or shooting star) for confirmation.
Would you like help setting up a stop loss or calculating the risk/reward ratio for this trade?
免責聲明
這些資訊和出版物並不意味著也不構成TradingView提供或認可的金融、投資、交易或其他類型的意見或建議。請在使用條款閱讀更多資訊。
免責聲明
這些資訊和出版物並不意味著也不構成TradingView提供或認可的金融、投資、交易或其他類型的意見或建議。請在使用條款閱讀更多資訊。