hello guys
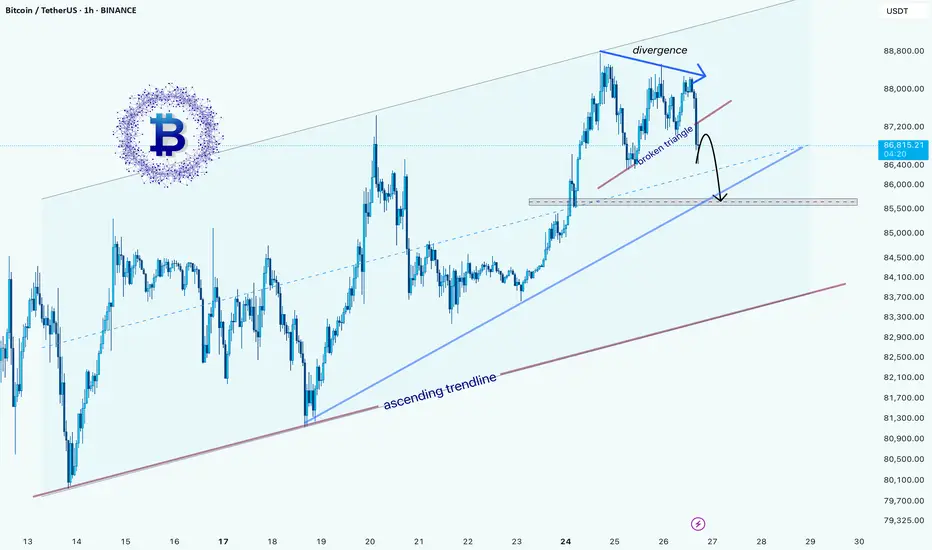
The Bitcoin/USDT chart shows an ascending channel with recent price action forming a divergence at the top, indicating potential weakening momentum. A bearish breakout from a smaller triangle suggests a short-term correction. The price may test the ascending trendline around $85,400, where a key support zone exists. If this level fails, a deeper correction toward the major support area around $76,800 could follow. However, if Bitcoin holds above the trendline, the uptrend could resume.
Traders should watch price action around the $85,400 level for confirmation of further downside or a potential bounce.
交易結束:目標達成
so close to the final target:註釋
The bottom line of the channel touched
👉 My recommended broker: bit.ly/HYMCMELI
____
Telegram: t.me/melikatrader94
Forex: t.me/melikatrader94GoldForex
____
Telegram: t.me/melikatrader94
Forex: t.me/melikatrader94GoldForex
相關出版品
免責聲明
這些資訊和出版物並不意味著也不構成TradingView提供或認可的金融、投資、交易或其他類型的意見或建議。請在使用條款閱讀更多資訊。
👉 My recommended broker: bit.ly/HYMCMELI
____
Telegram: t.me/melikatrader94
Forex: t.me/melikatrader94GoldForex
____
Telegram: t.me/melikatrader94
Forex: t.me/melikatrader94GoldForex
相關出版品
免責聲明
這些資訊和出版物並不意味著也不構成TradingView提供或認可的金融、投資、交易或其他類型的意見或建議。請在使用條款閱讀更多資訊。