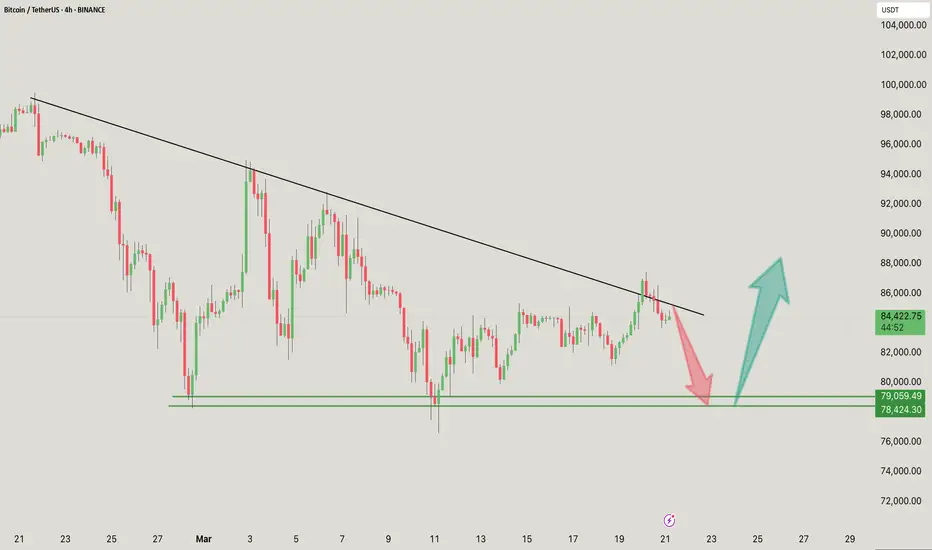
The Bitcoin (BTC/USDT) 4-hour chart suggests a key decision point near descending trendline resistance.
BTC is testing a key descending trendline, which has acted as resistance multiple times.
Rejection from this level could lead to a retracement towards the $79,000 – $78,400 support area (red arrow).
If BTC breaks above the trendline with strong volume, it could signal a bullish continuation towards $88,000+ (green arrow).
Immediate Resistance: $85,000
Key Support Area: $79,000 – $78,400
Breakout Target: $88,000+
If you found this analysis helpful, hit the Like button and share your thoughts or questions in the comments below. Your feedback matters!
Thanks for your support!
DYOR. NFA
相關出版品
免責聲明
這些資訊和出版物並不意味著也不構成TradingView提供或認可的金融、投資、交易或其他類型的意見或建議。請在使用條款閱讀更多資訊。