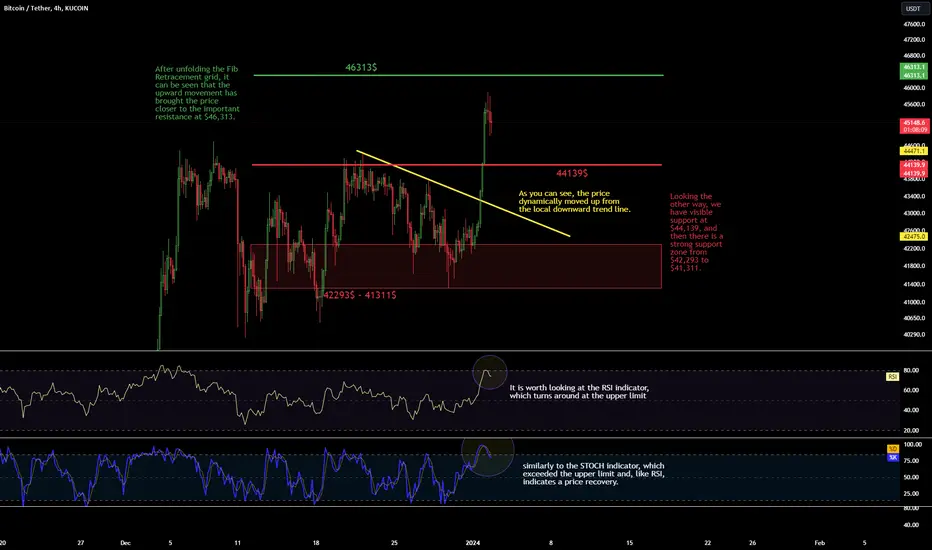
Hello everyone, let's take a look at the BTC to USDT chart on a four-hour time frame. As you can see, the price dynamically moved up from the local downward trend line.
After unfolding the Fib Retracement grid, it can be seen that the upward movement has brought the price closer to the important resistance at $46,313.
Looking the other way, we have visible support at $44,139, and then there is a strong support zone from $42,293 to $41,311.
It is worth looking at the RSI indicator, which turns around at the upper limit, similarly to the STOCH indicator, which exceeded the upper limit and, like RSI, indicates a price recovery.
免責聲明
這些資訊和出版物並不意味著也不構成TradingView提供或認可的金融、投資、交易或其他類型的意見或建議。請在使用條款閱讀更多資訊。
免責聲明
這些資訊和出版物並不意味著也不構成TradingView提供或認可的金融、投資、交易或其他類型的意見或建議。請在使用條款閱讀更多資訊。