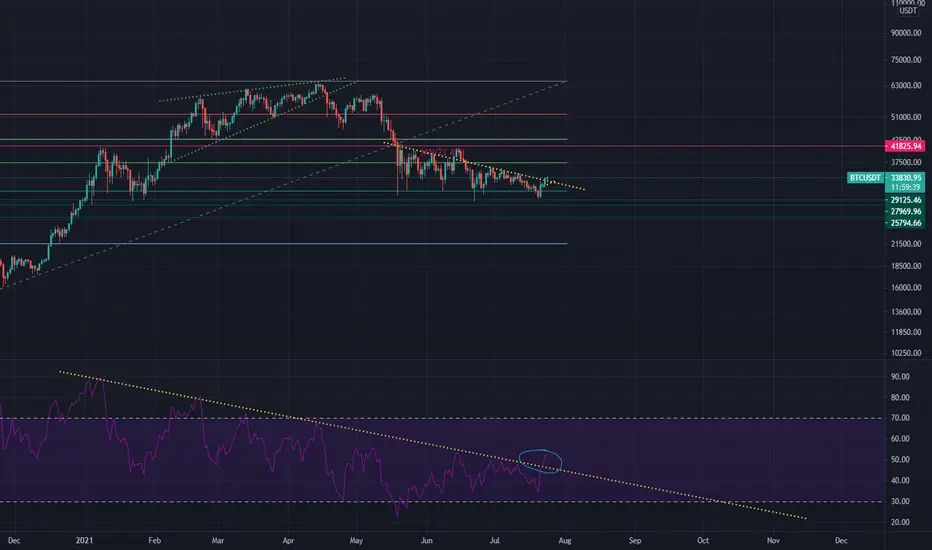
As seen on the daily RSI, Bitcoin has been on a momentum downtrend since the beginning of this year when we've hit the JAN/21 ATH at $41825. Since then, the momentum downtrend has started, with increasingly lower highs and lows, and it was only inevitable that the raising wedge would break down, and as the bulls momentum faded out, the "gravity" of the bears would bring the prices down.
Yesterday we have finally broken out from this downtrend, a very promising indication the bulls are back to take control. This doesn't mean we won't see lower lows again, the RSI is just a momentum indicator and it might take a while for the price to climb up. Besides you see, how many months it took for the RSI momentum indicator to match the actual price action from January to May. It seems though that a brand new long-term adventure is just starting for Bitcoin.
免責聲明
這些資訊和出版物並不意味著也不構成TradingView提供或認可的金融、投資、交易或其他類型的意見或建議。請在使用條款閱讀更多資訊。