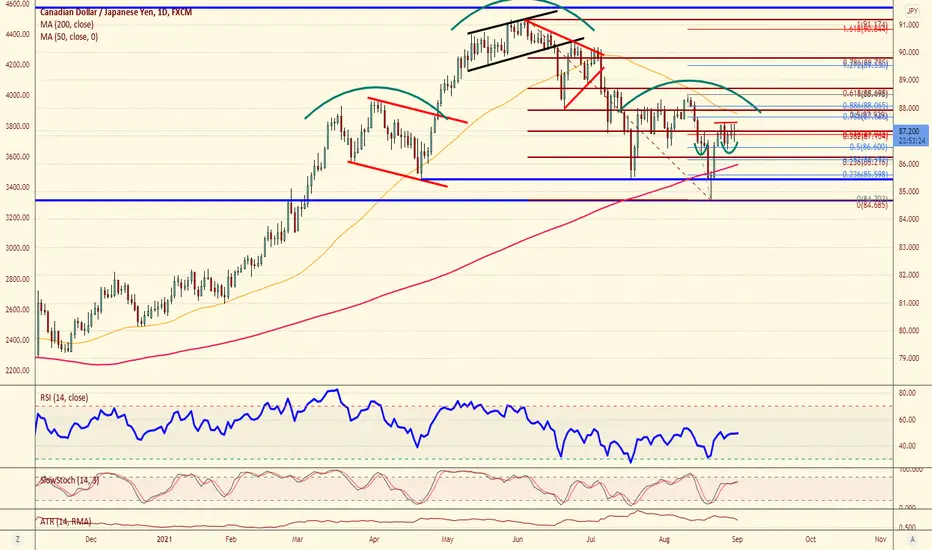
On August 16th, the CADJPY was our "Chart of the Day" (forexanalytix.com/blog/chart-of-the-day-aug-16th-2021/) and the pair was expected to develop the neckline of a possible longer term head and shoulder pattern. The pair did just that, but did a little more than expected. On that drop following August 16th, the pair fell to a low of the 84.67 level and bounced. The problem with this move is that created a "false breakdown" below the key 85.30 support and may have created a near term INVERSE head and shoulder pattern. If this pattern plays out we could rally towards the 88.50-89.00 level near term. With stocks at all time highs, the risk of a move higher from here is heightened.
Community - forexanalytix.com/sign_in
Prop trade with Forex Analytix - bit.ly/3t0NdRB
Forex Analytix Community Experience - forexanalytix.com/webinars/face/sign_up
Prop trade with Forex Analytix - bit.ly/3t0NdRB
Forex Analytix Community Experience - forexanalytix.com/webinars/face/sign_up
免責聲明
這些資訊和出版物並不意味著也不構成TradingView提供或認可的金融、投資、交易或其他類型的意見或建議。請在使用條款閱讀更多資訊。
