📉 Overview from Weekly Time Frame
CADMXN has broken a key weekly support level and formed a solid bearish candle. The pair also rejected and closed below the 50EMA, confirming sellers are in control on the higher timeframe.
📉 Daily Chart Explanation
The downtrend is well-established on the daily chart, with price consistently trading below both the 14EMA and 50EMA for several weeks. Momentum remains strong to the downside.
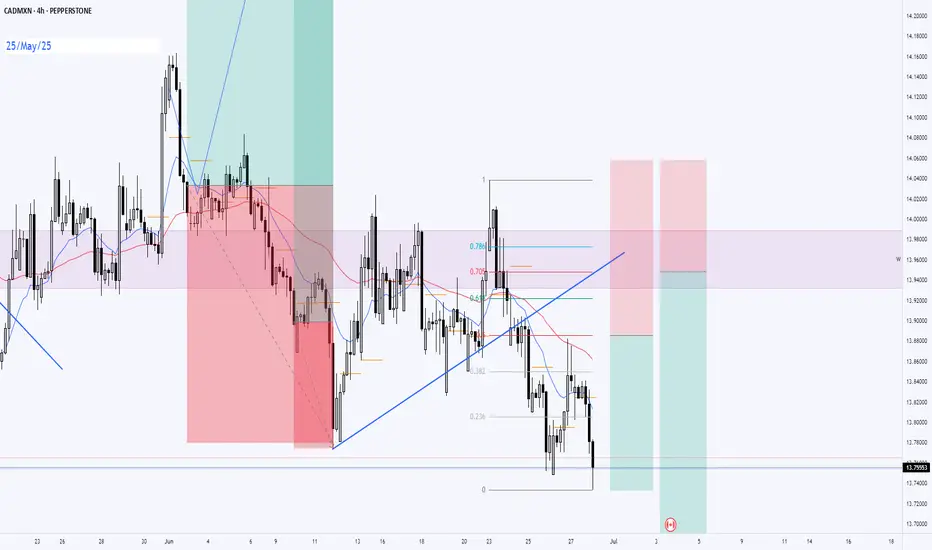
📉 4H Chart Explanation
On the 4H chart, a clean bearish structure is in place. Price continues forming lower highs and lower lows. The most recent swing low area offers a logical target zone for continuation trades, especially if price pulls back into a 4H supply area or EMA zone before continuing downward.
📌 Plan
Bias: Bearish
Entry: Look for price to pull back into 4H supply or near EMA zone (14/50EMA) and reject
Targets:
TP1: Recent 4H swing low area
TP2: Next untested 4H demand zone
Invalidation: Break and close above recent 4H structure high (above supply zone)
CADMXN has broken a key weekly support level and formed a solid bearish candle. The pair also rejected and closed below the 50EMA, confirming sellers are in control on the higher timeframe.
📉 Daily Chart Explanation
The downtrend is well-established on the daily chart, with price consistently trading below both the 14EMA and 50EMA for several weeks. Momentum remains strong to the downside.
📉 4H Chart Explanation
On the 4H chart, a clean bearish structure is in place. Price continues forming lower highs and lower lows. The most recent swing low area offers a logical target zone for continuation trades, especially if price pulls back into a 4H supply area or EMA zone before continuing downward.
📌 Plan
Bias: Bearish
Entry: Look for price to pull back into 4H supply or near EMA zone (14/50EMA) and reject
Targets:
TP1: Recent 4H swing low area
TP2: Next untested 4H demand zone
Invalidation: Break and close above recent 4H structure high (above supply zone)
免責聲明
這些資訊和出版物並不意味著也不構成TradingView提供或認可的金融、投資、交易或其他類型的意見或建議。請在使用條款閱讀更多資訊。
免責聲明
這些資訊和出版物並不意味著也不構成TradingView提供或認可的金融、投資、交易或其他類型的意見或建議。請在使用條款閱讀更多資訊。