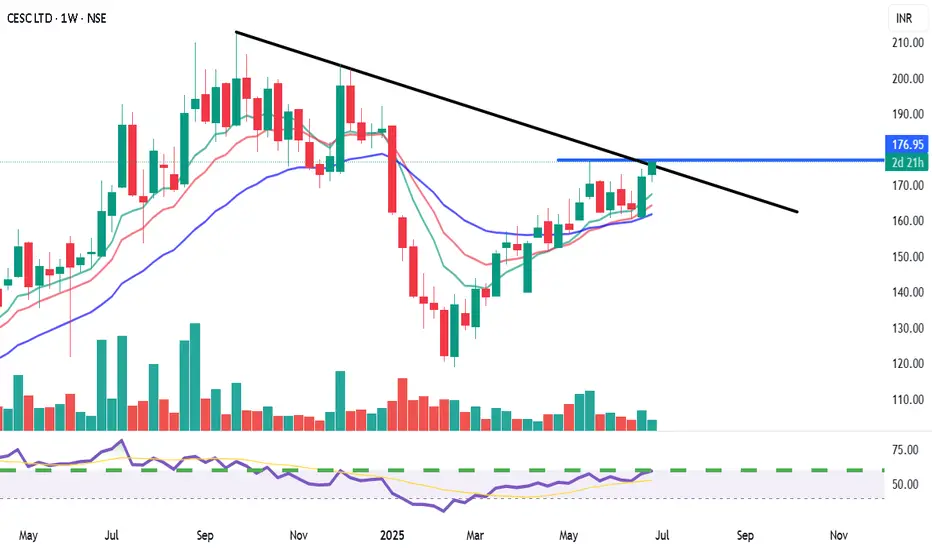
View: Bullish on confirmed breakout.
Bias: Positive momentum.
Strategy:
BUY: Above ₹178-180 (on weekly closing basis, confirming trendline and resistance breakout).
Targets (T):
T1: ₹195-200
T2: ₹210-220+
Stop-Loss (SL): ₹168 (on weekly closing basis).
Reasoning:
Attempting a breakout from a significant descending trendline.
Cleared horizontal resistance at ₹175.
Bullish crossover in moving averages with price above all MAs.
Strong RSI and supportive volume.
Potential for a major trend reversal.
Note: This is an educational analysis and not financial advice. Do your own due diligence before investing.
免責聲明
這些資訊和出版物並非旨在提供,也不構成TradingView提供或認可的任何形式的財務、投資、交易或其他類型的建議或推薦。請閱讀使用條款以了解更多資訊。