Hello Traders,
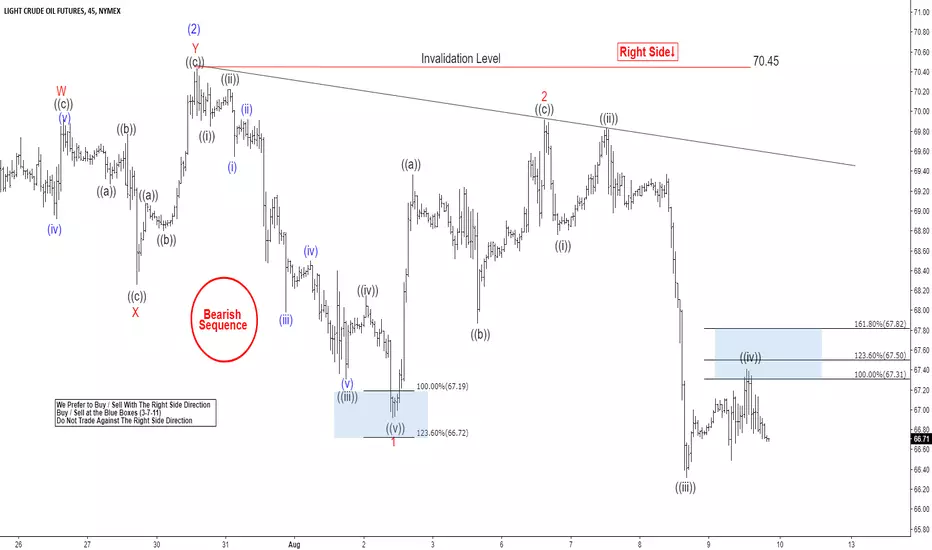
Short-term Elliott wave analysis suggests that the bounce to $70.44 high ended blue wave (2). The internals of that bounce took place as Elliott wave double correction where red wave W ended in 3 swings at $69.92. From there, the pullback to $68.26 completed the red wave X in 3 swings. Then a bounce higher to $70.44 high ended red wave Y in another 3 swings & also completed blue wave (2).
Down from there, the decline is taking place as Elliott wave impulse within blue wave (3) lower with the sub-division of 5 waves structure in red wave 1, 3 & 5. The initial decline from $70.44 high to $66.92 low ended red wave 1. The lesser degree cycles within that decline also unfolded in 5 waves structure & ended black wave ((i)) at $69.91. Black wave ((ii)) ended at $70.22, Black wave ((iii)) ended at $67.31 low, black wave ((iv)) bounce ended at $68.15 and black wave ((v)) of red 1 ended at $66.92 low. Above from there, the bounce to $69.92 high ended red wave 2.
The internals of red wave 2 unfolded in 3 swings as Elliott wave zigzag correction where black wave ((a)) ended in 5 waves at $69.36. Black wave ((b)) ended at $67.87 low and the bounce to $69.92 high ended black wave ((c)) of 2. Down from there, red wave 3 remain in progress in another 5 waves and as far as bounces fail below $69.92 high and more importantly the pivot from $70.45 high stays intact instrument is expected to see more downside. We don’t like buying it as the right side tag is lower.
14 days trial --> elliottwave-forecast.com/plan-trial/ and get Accurate & timely Elliott Wave Forecasts of 78 instruments. Webinars, Chat Room, Stocks/Forex/Indices Signals & more.
免責聲明
這些資訊和出版物並不意味著也不構成TradingView提供或認可的金融、投資、交易或其他類型的意見或建議。請在使用條款閱讀更多資訊。
14 days trial --> elliottwave-forecast.com/plan-trial/ and get Accurate & timely Elliott Wave Forecasts of 78 instruments. Webinars, Chat Room, Stocks/Forex/Indices Signals & more.
免責聲明
這些資訊和出版物並不意味著也不構成TradingView提供或認可的金融、投資、交易或其他類型的意見或建議。請在使用條款閱讀更多資訊。
