看多
CND symmetric triangle on 15 minute - target 400 sats
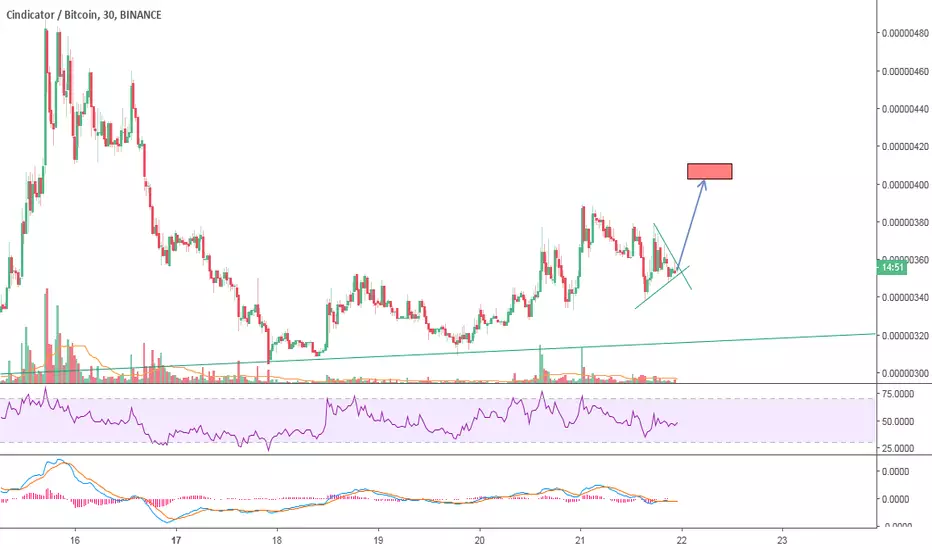
Just posting this for fun (and seeing if it comes true!). Symmetric triangle clearly visible on the 15 minute chart. Presumes ongoing bullish trend reversal has taken place in CND, which I identified approximately two weeks ago (prior to PBC pump). Can buy in now and sell at 400 sats for a quick profit. I could be wrong, though.
免責聲明
這些資訊和出版物並不意味著也不構成TradingView提供或認可的金融、投資、交易或其他類型的意見或建議。請在使用條款閱讀更多資訊。
免責聲明
這些資訊和出版物並不意味著也不構成TradingView提供或認可的金融、投資、交易或其他類型的意見或建議。請在使用條款閱讀更多資訊。