1. Technical Structure & Overall Trend
The price has recently broken out of lower lows and experienced a strong upward movement.
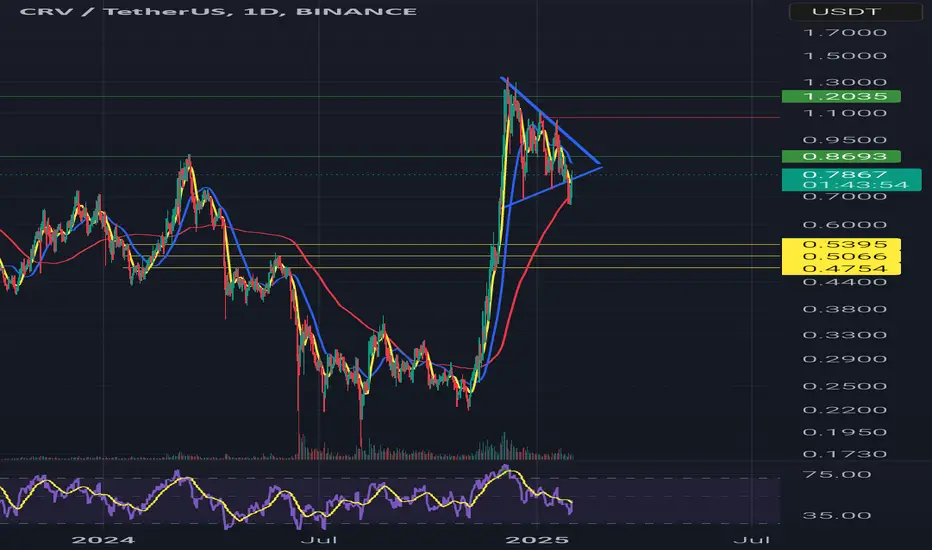
Currently, it is forming a symmetrical triangle pattern, indicating price compression and a potential breakout in either direction.
Moving averages are sloping upwards, suggesting a mid-term bullish trend.
Key support levels are at 0.5395, 0.5066, and 0.4754 USDT.
Major resistance levels are at 0.8693 and 1.2035 USDT.
2. Potential Trade Scenarios
✅ Bullish Scenario (Breakout to the Upside)
If the price breaks above the upper trendline of the triangle with strong volume, it could move towards 0.8693, and further towards 1.2035.
Entry: After a breakout confirmation and price stabilization above the resistance.
Stop-loss: Below the last low of the pattern (e.g., 0.70 or 0.68 depending on the breakout).
❌ Bearish Scenario (Breakdown to the Downside)
If the price breaks below the lower support of the triangle, it could retrace towards the 0.5395 and 0.5066 support zones.
Entry: After a confirmed breakdown and price stabilization below support.
Stop-loss: Above the lost support level (e.g., 0.80 or 0.82).
3. Entry Strategy & Risk Management
Conservative Entry: Wait for a breakout confirmation with a solid candle close.
Risk-to-Reward Ratio: A minimum of 2:1 is recommended for a reasonable trade.
Stop-loss & Take-profit: Set according to the chosen scenario.
Risk Management: Maintain a 1% risk per trade in line with your trading strategy.
Conclusion
The triangle pattern is nearing completion, and a breakout in the coming days is highly likely. It is recommended to wait for a decisive breakout in either direction before entering a trade.
免責聲明
這些資訊和出版物並不意味著也不構成TradingView提供或認可的金融、投資、交易或其他類型的意見或建議。請在使用條款閱讀更多資訊。
免責聲明
這些資訊和出版物並不意味著也不構成TradingView提供或認可的金融、投資、交易或其他類型的意見或建議。請在使用條款閱讀更多資訊。