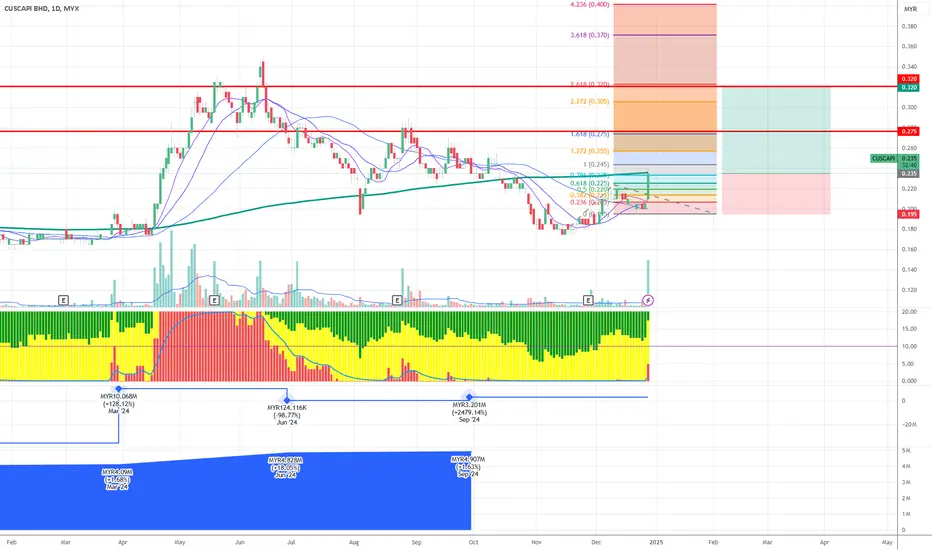
Historical Movement
The stock saw a major peak around 0.370 (marked at 3.618 level)
Experienced a significant downtrend from June to September 2024
Currently showing potential consolidation and base formation
Key Technical Levels:
Resistance Levels:
Major resistance at 0.275 (marked in red)
Secondary resistance at 0.245
Currently testing intermediate resistance around 0.225-0.230
Support Levels:
Strong support at 0.180
Immediate support trend line (green) acting as dynamic support
Price has formed a higher low pattern recently
Technical Indicators:
Moving Averages:
Multiple MAs show potential crossover points
Price is currently testing the shorter-term MAs from below
The longer-term MA (likely 200-day) is still trending downward
Volume Analysis:
Recent volume spike shows increasing interest
Volume generally higher during downtrends
Current consolidation showing reduced volume, typical of base formation
Trading Setup (Current):
Risk Management:
Stop Loss: 0.040 (17.02% risk)
Target: 0.085 (36.17% potential reward)
Risk/Reward ratio: 2.13 (favorable)
Chart Pattern:
Appears to be forming a potential inverse head and shoulders pattern
Neckline resistance around 0.225-0.230
Volume pattern supporting the potential reversal setup
Market Structure:
Shows signs of transitioning from downtrend to potential bottoming phase
Multiple support levels being established
Fibonacci retracement levels marking key resistance zones
免責聲明
這些資訊和出版物並不意味著也不構成TradingView提供或認可的金融、投資、交易或其他類型的意見或建議。請在使用條款閱讀更多資訊。
免責聲明
這些資訊和出版物並不意味著也不構成TradingView提供或認可的金融、投資、交易或其他類型的意見或建議。請在使用條款閱讀更多資訊。