Hello Traders,
In this short-term analysis, we will have a look at the German DAX Index.
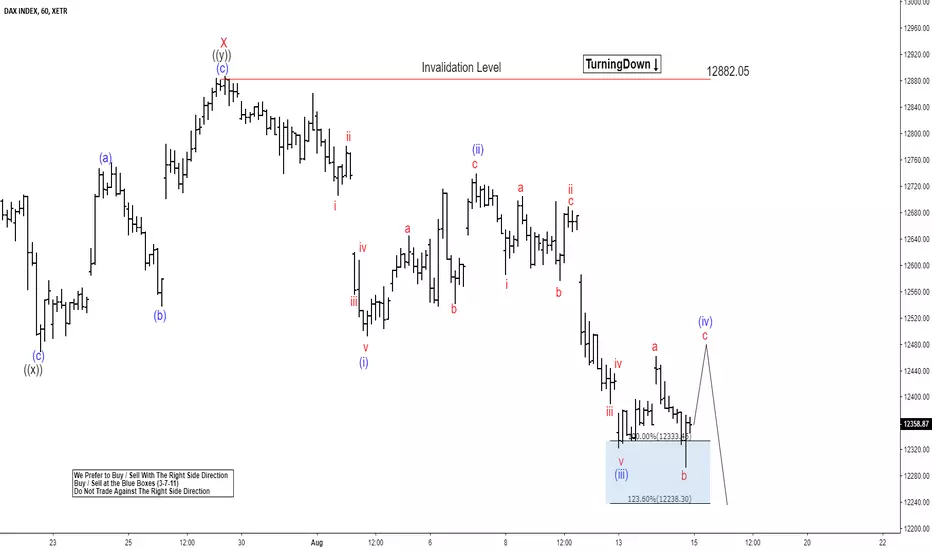
DAX short-term Elliott wave analysis suggests that the rally to 12882.05 high ended red wave X bounce. The internals of that bounce unfolded as Elliott wave double three structure where black wave ((w)) ended at 12640.87. Black wave ((x)) ended at 12468.68 and black wave ((y)) of red X ended at 12882.05 high.
Down from there, DAX is currently suggesting that it is unfolding as a potential 5 waves structure. Where blue wave (i) ended at 02/08/18 low (12491.53), blue wave (ii) pullback at 07/08/18 peak (12740.66), and blue wave (iii) at 08/13/18 low (12321.45). Currently, it is in the progress of making a pullback in blue wave (iv) before extending 1 more leg lower in blue wave (v) before a 3 waves bounce higher can be seen. We don’t like selling it.
In this short-term analysis, we will have a look at the German DAX Index.
DAX short-term Elliott wave analysis suggests that the rally to 12882.05 high ended red wave X bounce. The internals of that bounce unfolded as Elliott wave double three structure where black wave ((w)) ended at 12640.87. Black wave ((x)) ended at 12468.68 and black wave ((y)) of red X ended at 12882.05 high.
Down from there, DAX is currently suggesting that it is unfolding as a potential 5 waves structure. Where blue wave (i) ended at 02/08/18 low (12491.53), blue wave (ii) pullback at 07/08/18 peak (12740.66), and blue wave (iii) at 08/13/18 low (12321.45). Currently, it is in the progress of making a pullback in blue wave (iv) before extending 1 more leg lower in blue wave (v) before a 3 waves bounce higher can be seen. We don’t like selling it.
14 days trial --> elliottwave-forecast.com/plan-trial/ and get Accurate & timely Elliott Wave Forecasts of 78 instruments. Webinars, Chat Room, Stocks/Forex/Indices Signals & more.
免責聲明
這些資訊和出版物並不意味著也不構成TradingView提供或認可的金融、投資、交易或其他類型的意見或建議。請在使用條款閱讀更多資訊。
14 days trial --> elliottwave-forecast.com/plan-trial/ and get Accurate & timely Elliott Wave Forecasts of 78 instruments. Webinars, Chat Room, Stocks/Forex/Indices Signals & more.
免責聲明
這些資訊和出版物並不意味著也不構成TradingView提供或認可的金融、投資、交易或其他類型的意見或建議。請在使用條款閱讀更多資訊。